

.svg)

William Mahmood
Head of Data Science, MUBI
Build collaboratively
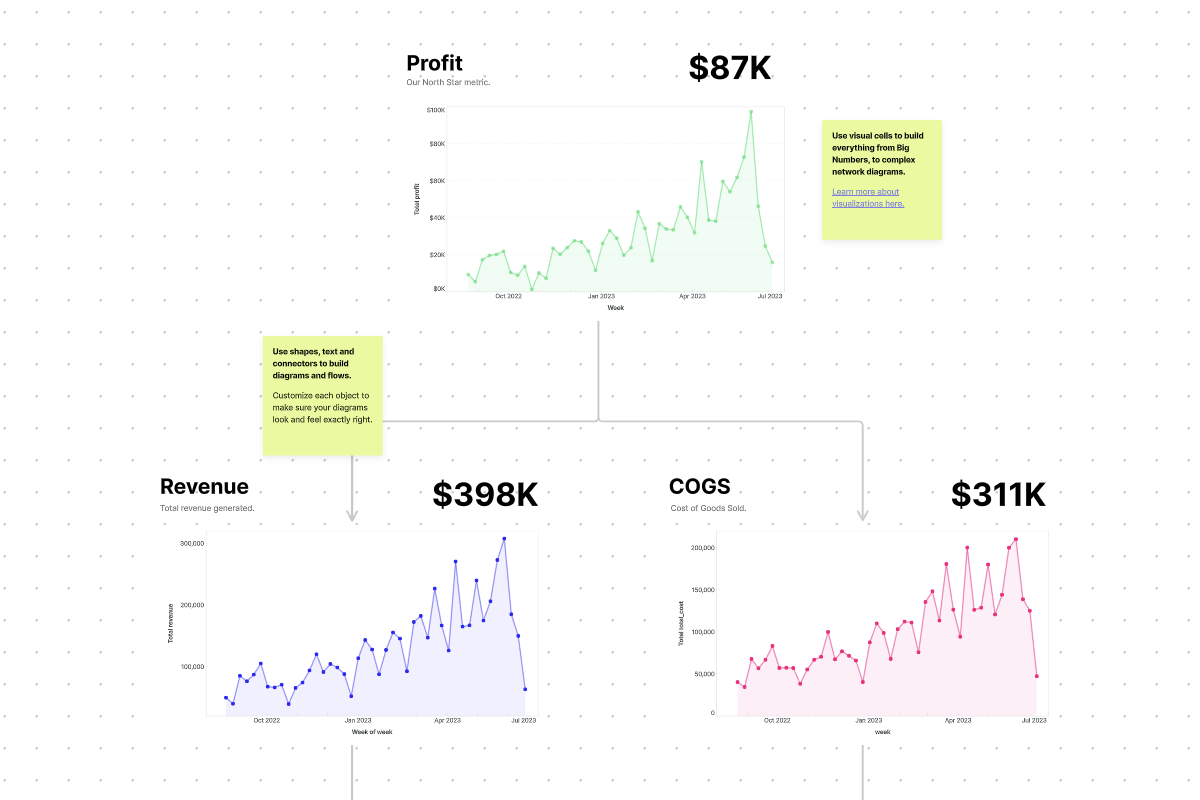
Scope, model and build the metric tree in an infinite collaborative canvas. collaborate and prototype features with sticky notes, and iterate impacts of different metrics in an inf
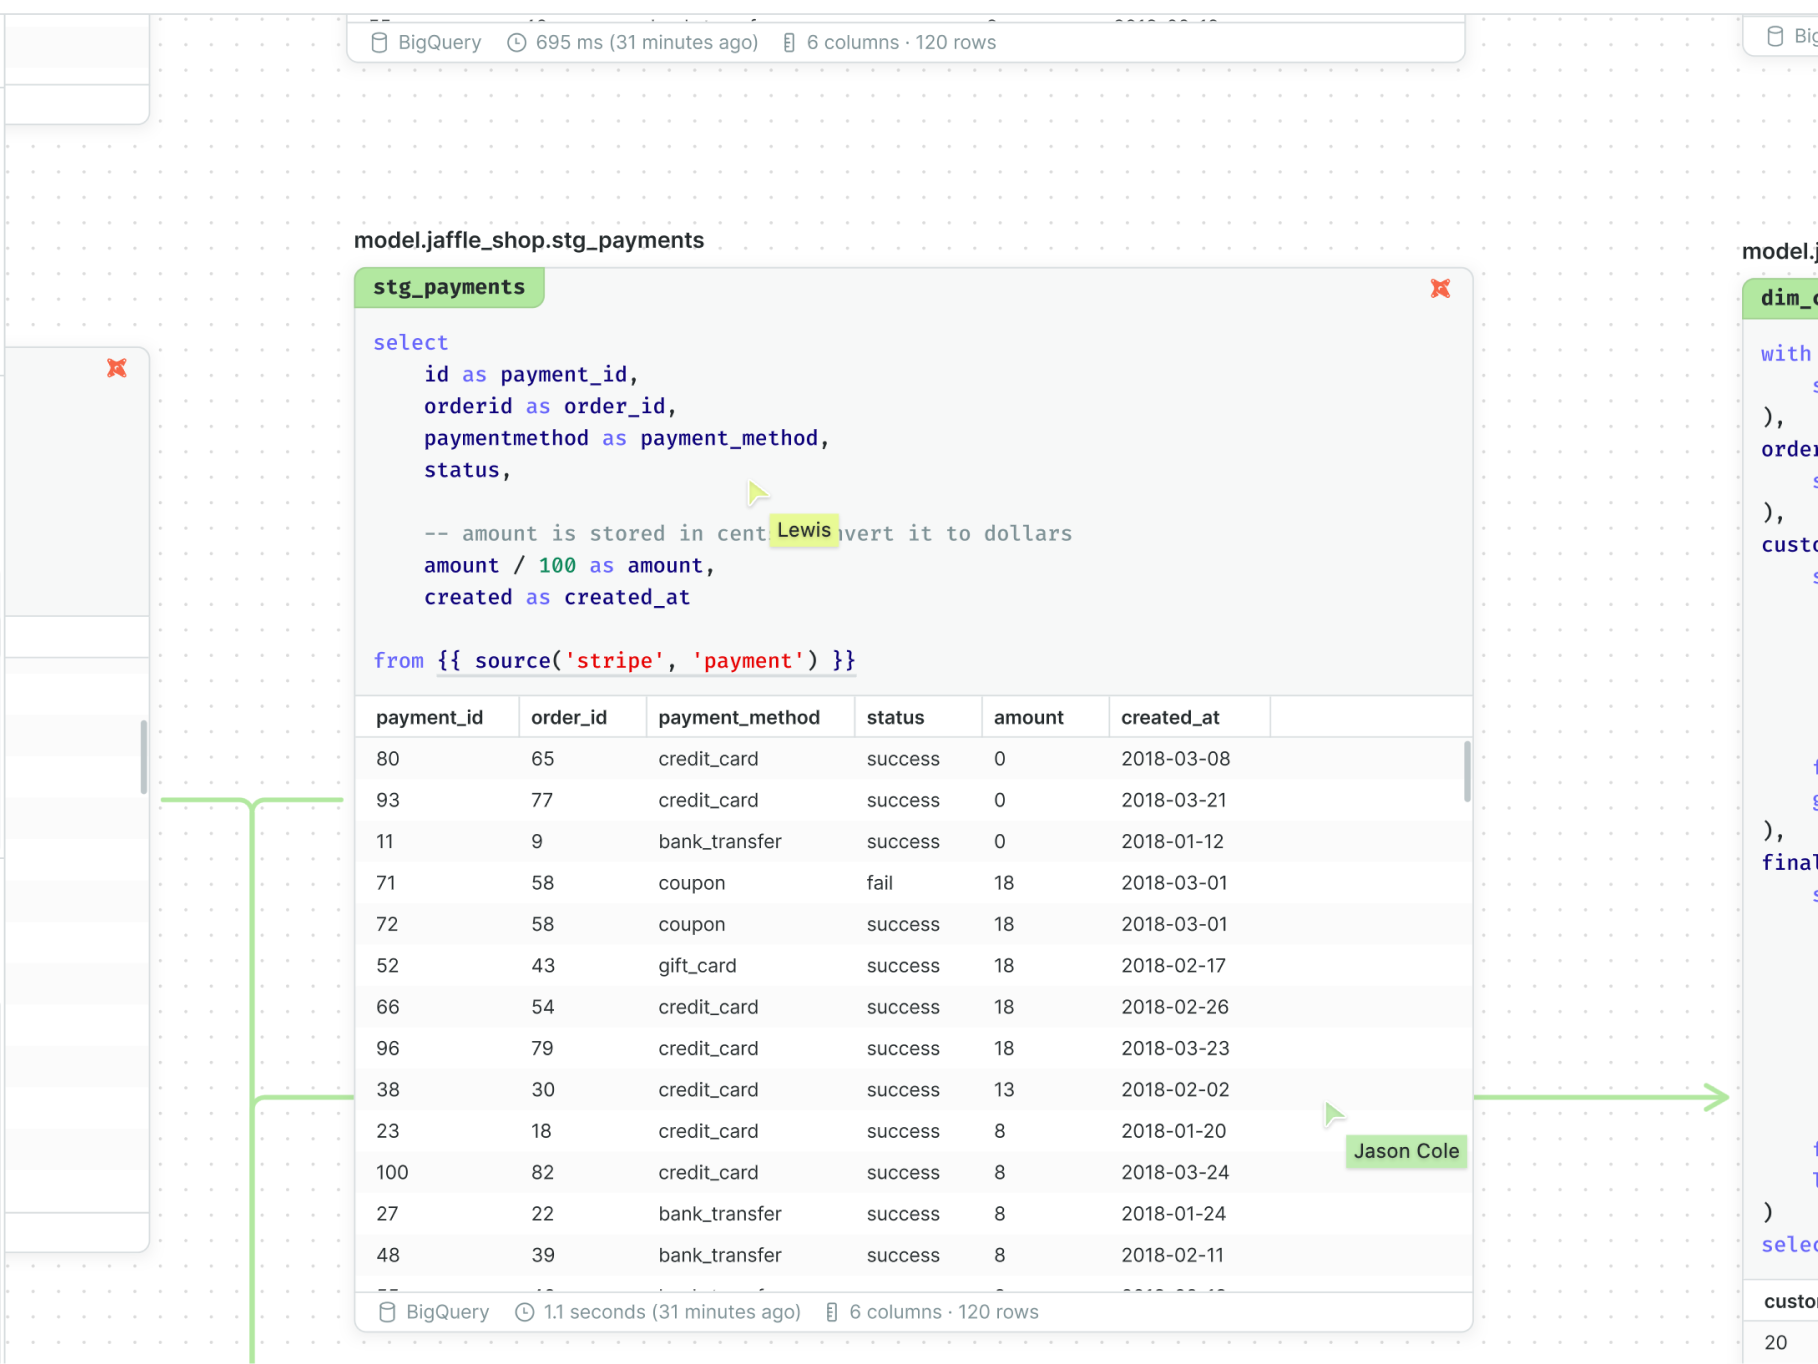
Build your metric with data from your database, CSV file, or a Python script
Use SQL and Python cells to do transformations and aggregations. Use Count’s visualize to customize exactly how you want to display your metrics.

Not just data. Import business context from other tools.
Embed Miro boards, add app screenshots, or even make notes of assumptions on sticky notes. The canvas is made for more than just data.


From canvas to boardroom in one click.
Turn your metric tree into a presentable dashboard that can be exported as pdf, pushed to slack or email on any cadence

Slice and dice with filters
Build your tree to be as large and as complex as you want. Count has query caching and local cells so you can keep your database costs low without sacrificing visibility.

Built for scaling
Build your tree to be as large and as complex as you want. Count has query caching and local cells so you can keep your database costs low without sacrificing visibility.

Get notified of big changes with Slack alerts
Use custom alerts to get notified when key metrics change, so you can take action as quickly as possible.

See a metric tree in action.
.png)
Get started for free
Start solving your organization's biggest problems with Count today.
