4.8/5
Home

Integrations

Plug Count neatly into your existing data infrastructure

For data teams

Collaborative, AI-driven data exploration and modelling

For product & growth

Faster access to the answers which matter

For leaders

Turning data into an engine of improvement

Pricing

Latest post

Meet the new Count Agent

Meet the new Count Agent

Docs

Guides, references, and API docs

Blog

Opinions, analysis, and the occasional uncomfortable truth about data.

Webinars

Join our experts for deep dives into data analytics and business intelligence

Gallery

Browse ready-to-use canvas templates and try them instantly

Sign in

Where to begin?

Start for free

Spin up a canvas and explore your data — a couple of clicks, no card.

Book a demo

See it live. Bring your questions — we’ll bring the answers.

Still not sure?

Send us a note — we’ll point you the right way.


Data to decisions, faster.

Compare

  • Count vs BI
  • Count vs Notebooks
  • Count vs Chatbots
  • Count vs Hex
  • Count vs Looker
  • Count vs Tableau
  • Count vs Thoughtspot

Learn

  • Blog
  • Webinars
  • SQL tutorials

Legal & security

  • Privacy Policy
  • Terms of Use
  • Cookies Policy
  • Trust Center
  • Security

Social

  • LinkedIn →
  • YouTube →
  • X →

Start with the hard question.

Ask Count anything — we’ll take you straight into a canvas.

Opens sign-up with your prompt ready for Count.

© 2026 Count Technologies Ltd. All rights reserved.

Careers →Book a Demo →
count
← Back to blog home
September 15, 2025

Requirements gathering canvas template

Written by The Count Team

Automation
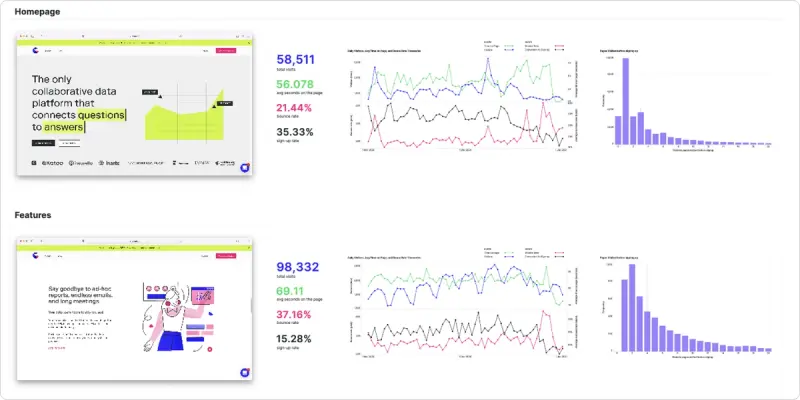
Create dynamic data stories with our flexible canvas template. Customize with images, diagrams, and pop-outs for a clutter-free, engaging presentation. Explore the full example now!
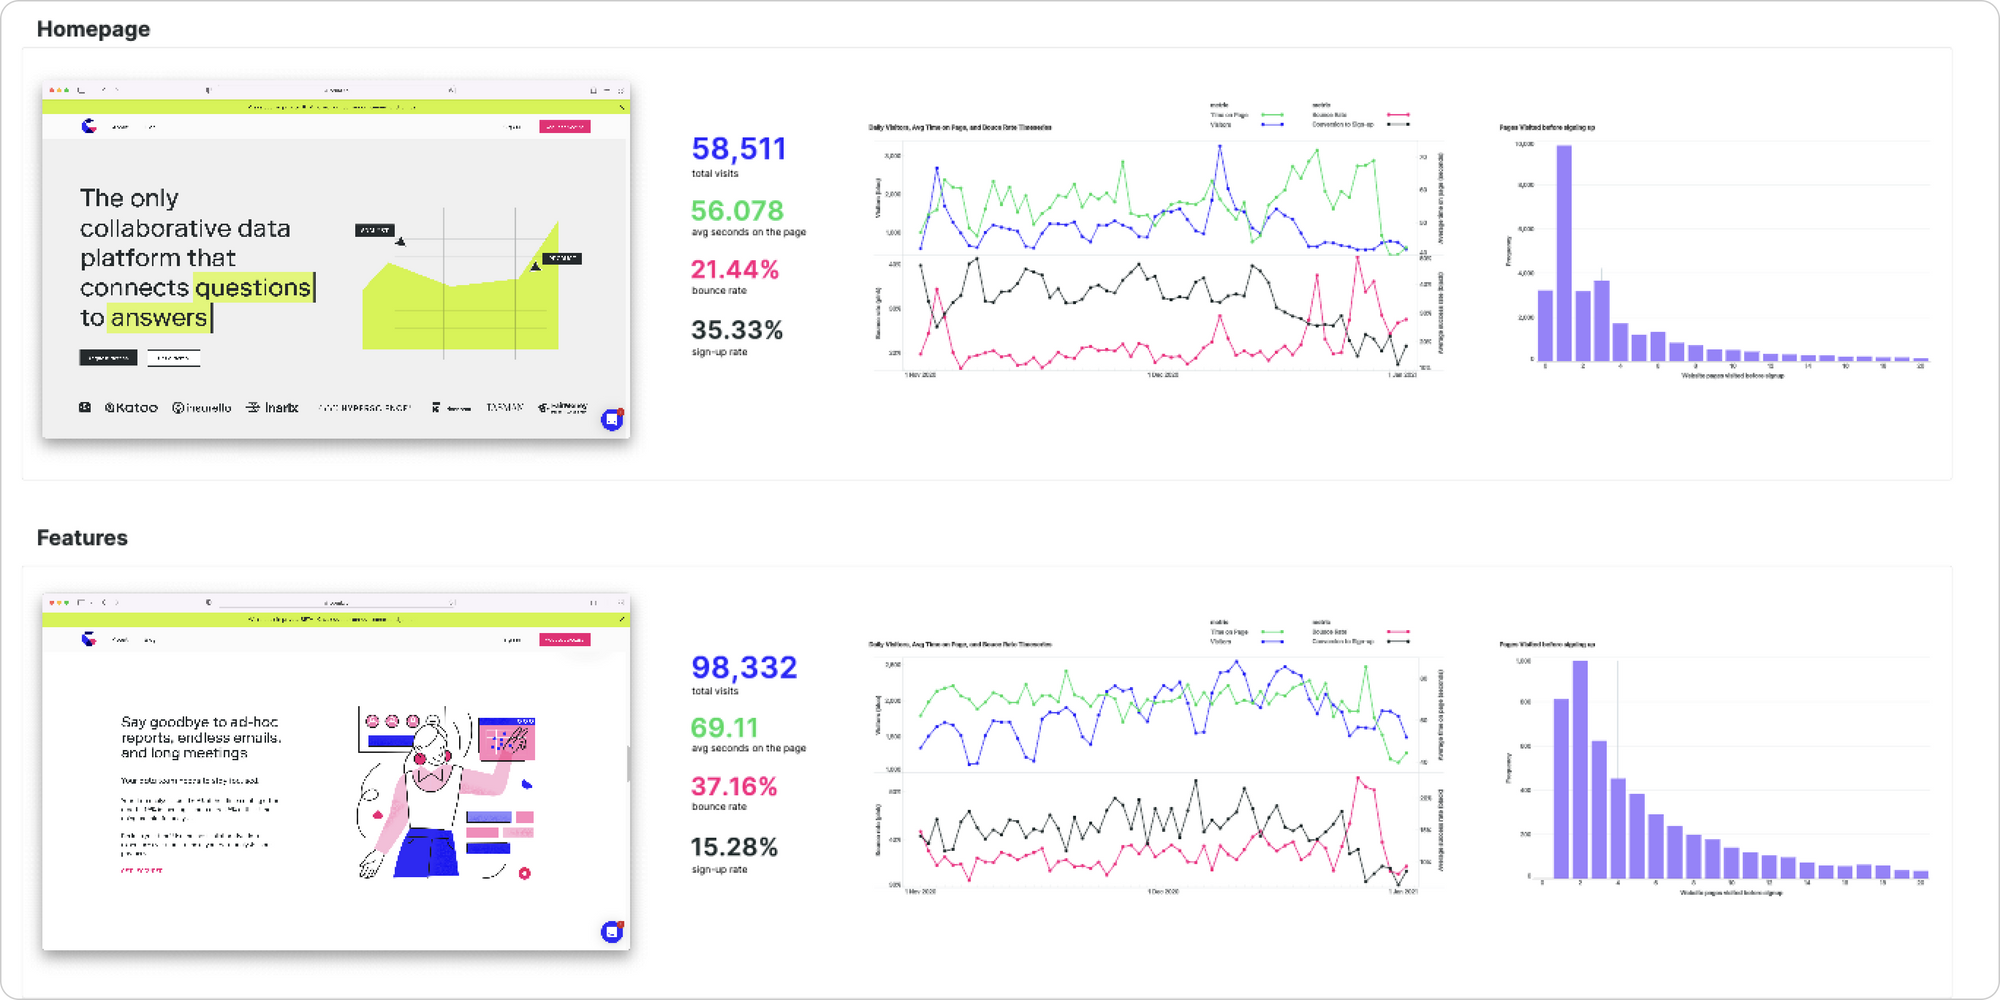
This KPI report is an excellent example of how the flexibility and design features of the canvas let you build a data story exactly the way you want. Start with Count’s notebook template to quickly build your structure but then customise it by embedding images and graphics, drawing diagrams and adding pop-out sections to give additional detail without cluttering up the main story.

There really is no limit to the way you tell data stories…

Explore the full examplehere.