Not just the answer.
The space to understand it
Count is a collaborative analytics platform.
Use AI to make great decisions, not just build charts.
Revenue by Product Category
Prepared by Remy, Head of Data
Supporting faster decisions at data-led companies:


It shouldn't take five dashboards, two meetings, four DB queries and an argument with a chatbot to make a decision.
Interface
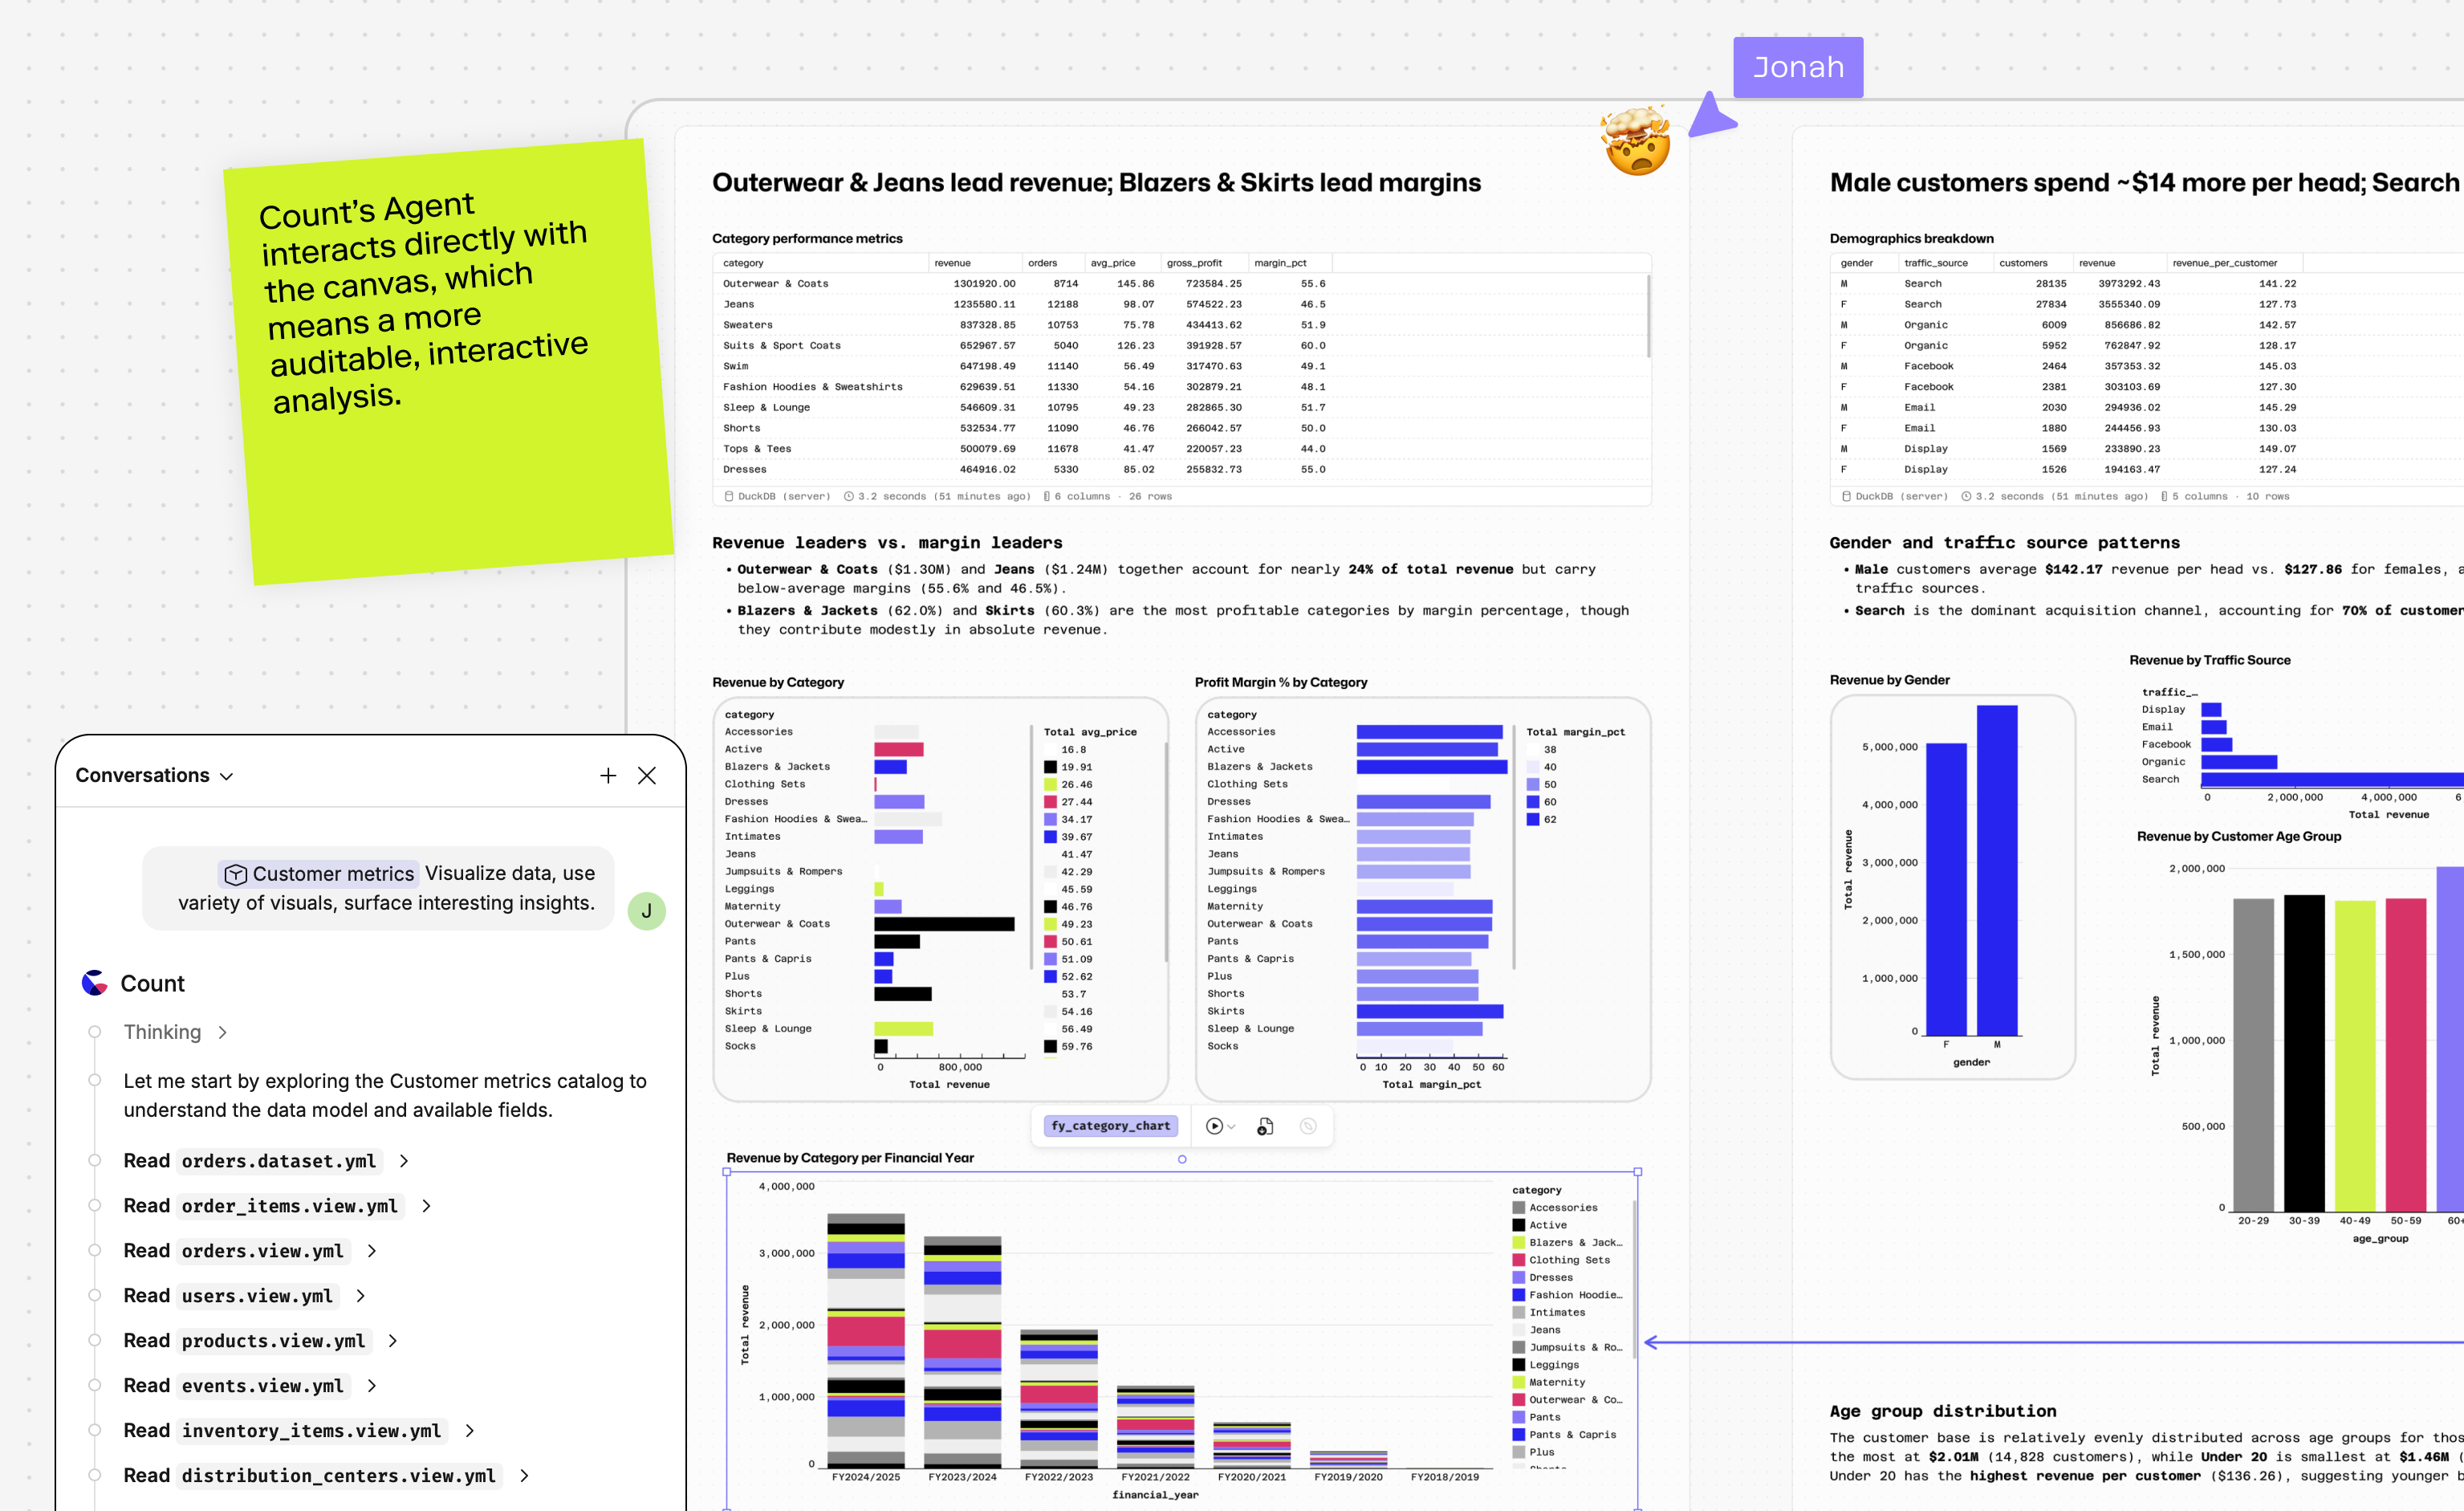
A space where agents and humans work together.
The canvas is a collaborative space where teams explore data and solve problems. All powered by AI.
Support Tickets — Weekly Performance
12-week windowFeb 16 – May 4, 2026 · Powered by Count agent
Tickets created per week
Tickets by category
Avg first-response time
Tickets created per week
Support Tickets — Weekly Performance
12-week windowFeb 16 – May 4, 2026 · Powered by Count agent
Tickets created per week
Tickets by category
Avg first-response time
Avg first-response time per week
“Best data tool I have discovered since dbt.”
Jessica Franks, Data Engineering Manager, Funding Circle
Data teams
All the tools data teams need to do their best work
Switch seamlessly between SQL, python and visuals laying out logic and insights as you go.
Build reusable logic and shared definitions without losing context across your team's workflows.
Move from analysis to narrative quickly with live visuals and collaborative context in one space.
Self-service
Give trusted answers to everyone in your business
“Our sales team was able to build beautiful dashboards on their own.”
Stefani Ivanova, Data Engineer, Omnipresent
Bring data into conversations on Slack or into other agent workflows via Count's MCP client.
Share trusted definitions and business logic so teams can self-serve with confidence.
Guide agent behavior with the context, rules, and source boundaries your team depends on.
Bring in any data and share answers anywhere
Connect Count directly to your data warehouse, BI tool, semantic layer, or any business app via MCP. All your data, now fully explorable in one place.


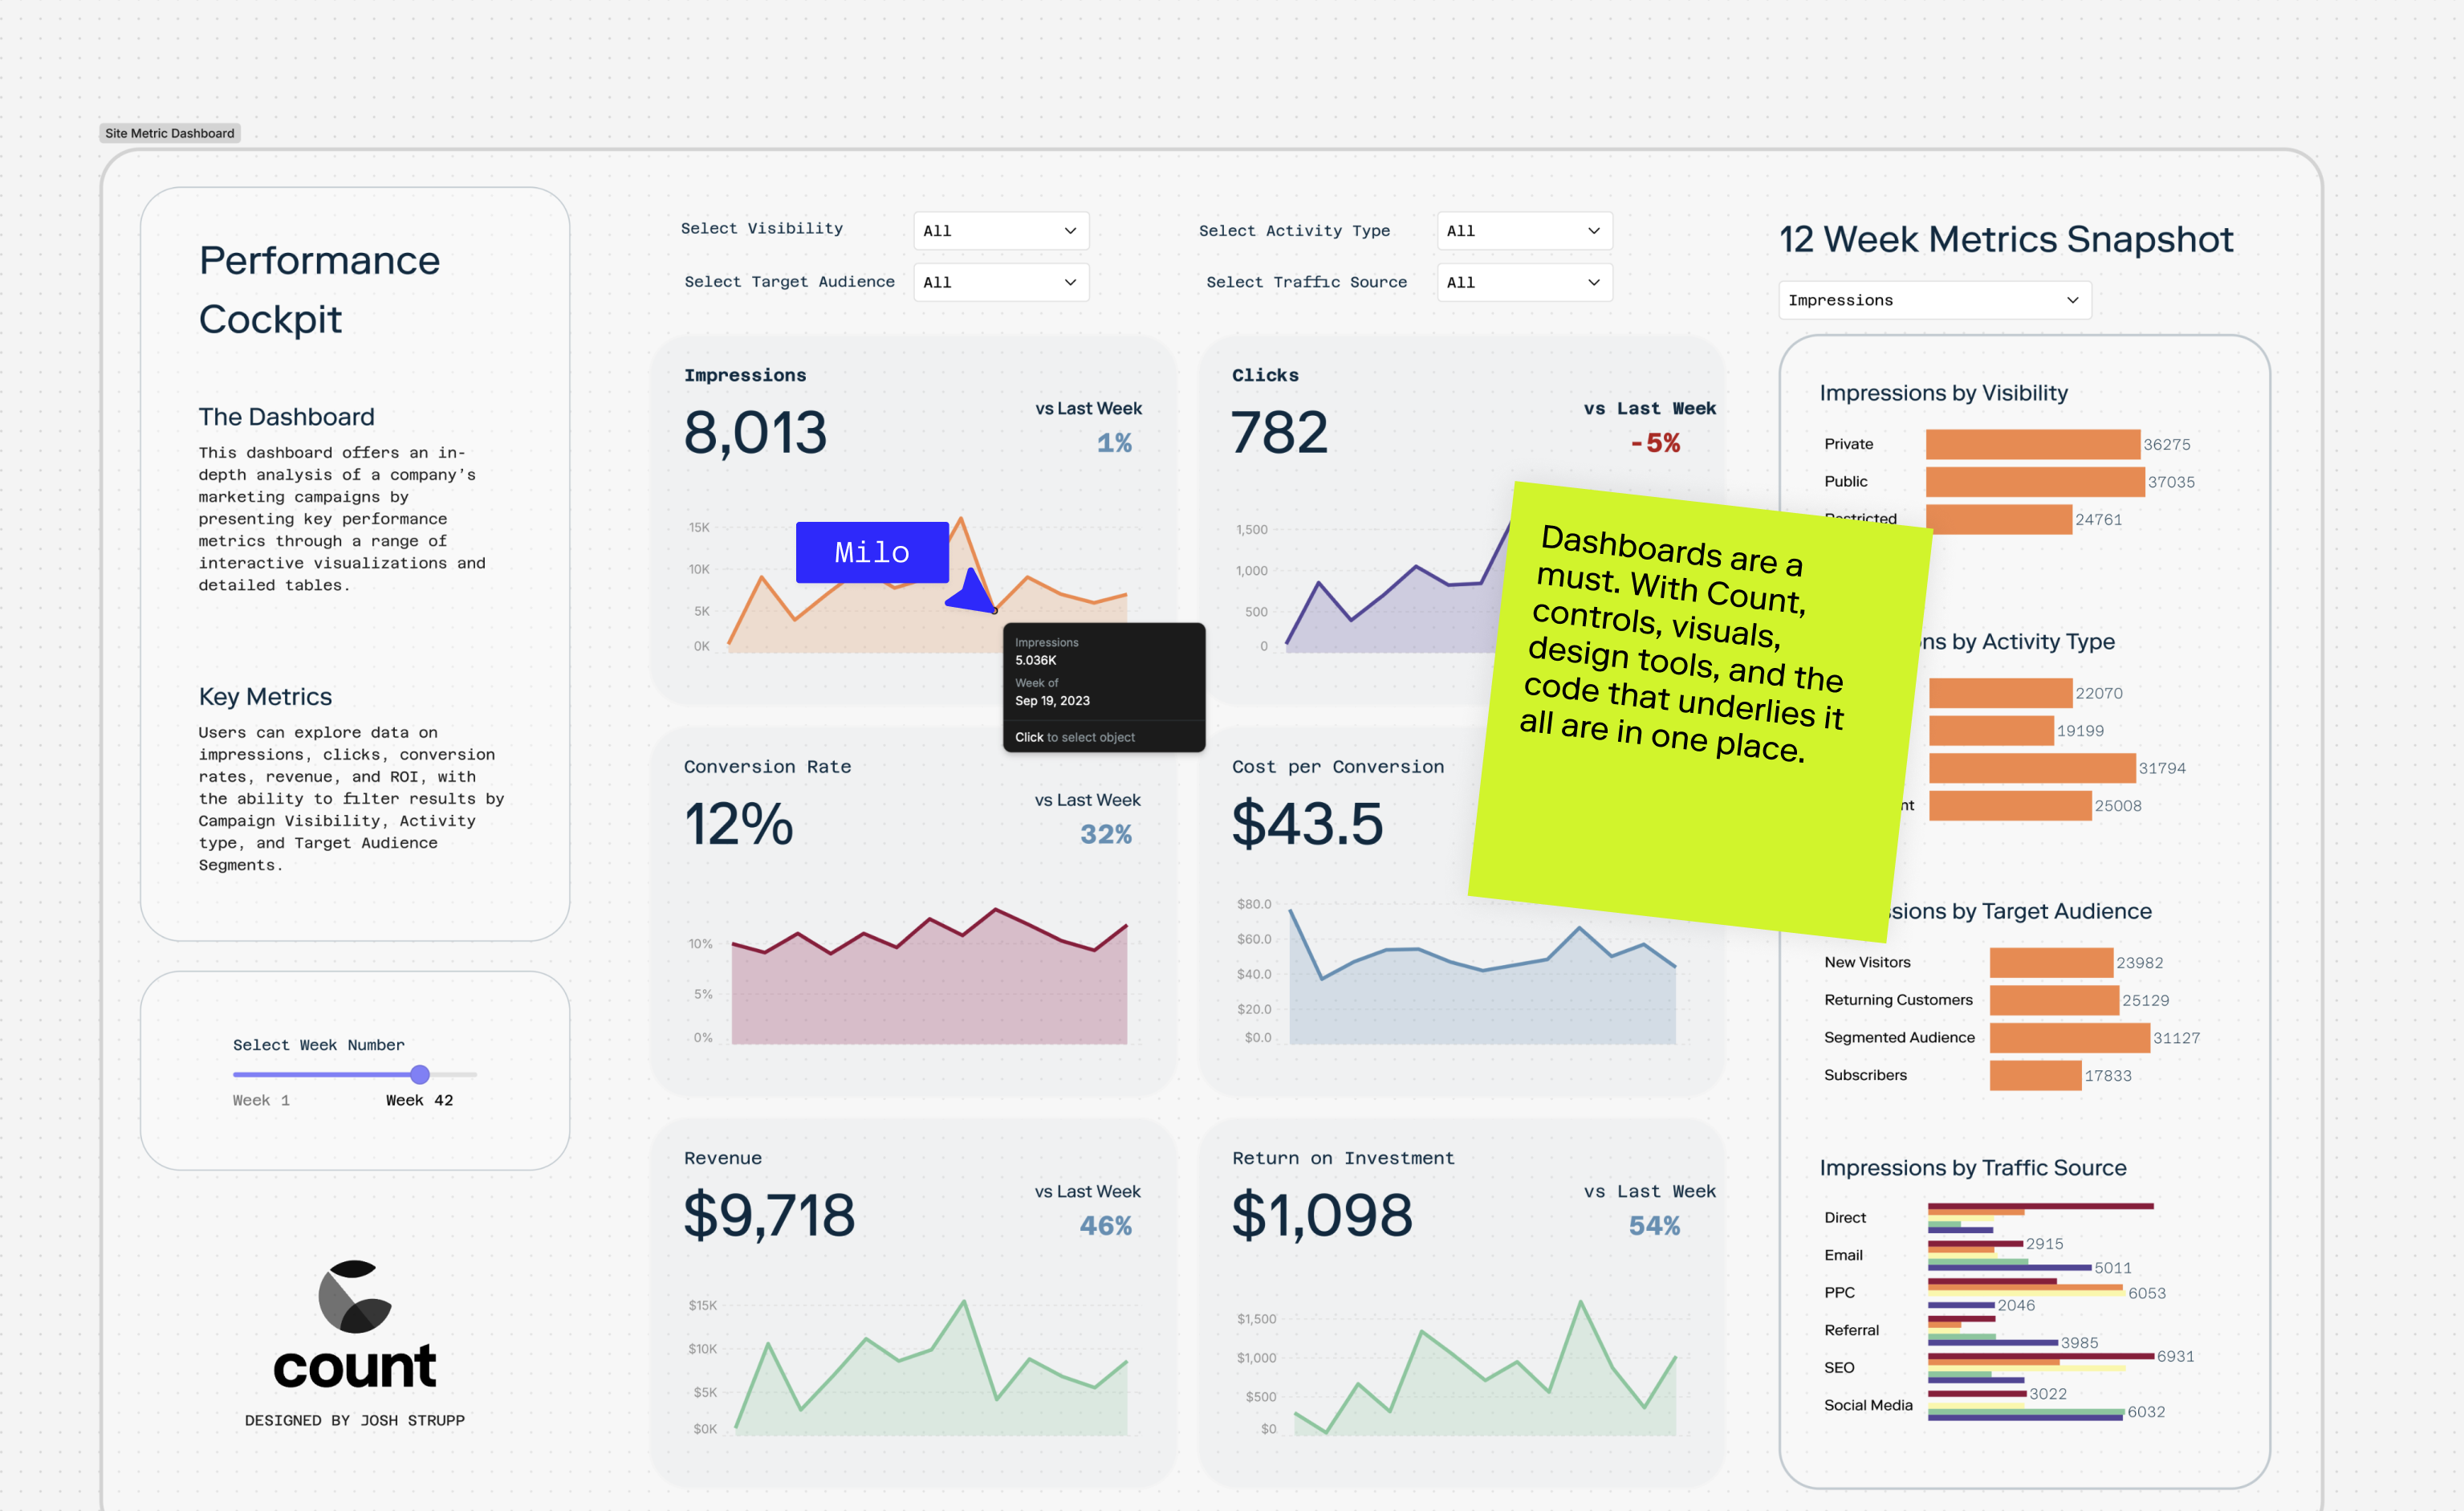
Reports
Clearer than a dashboard. More actionable than a chat thread.
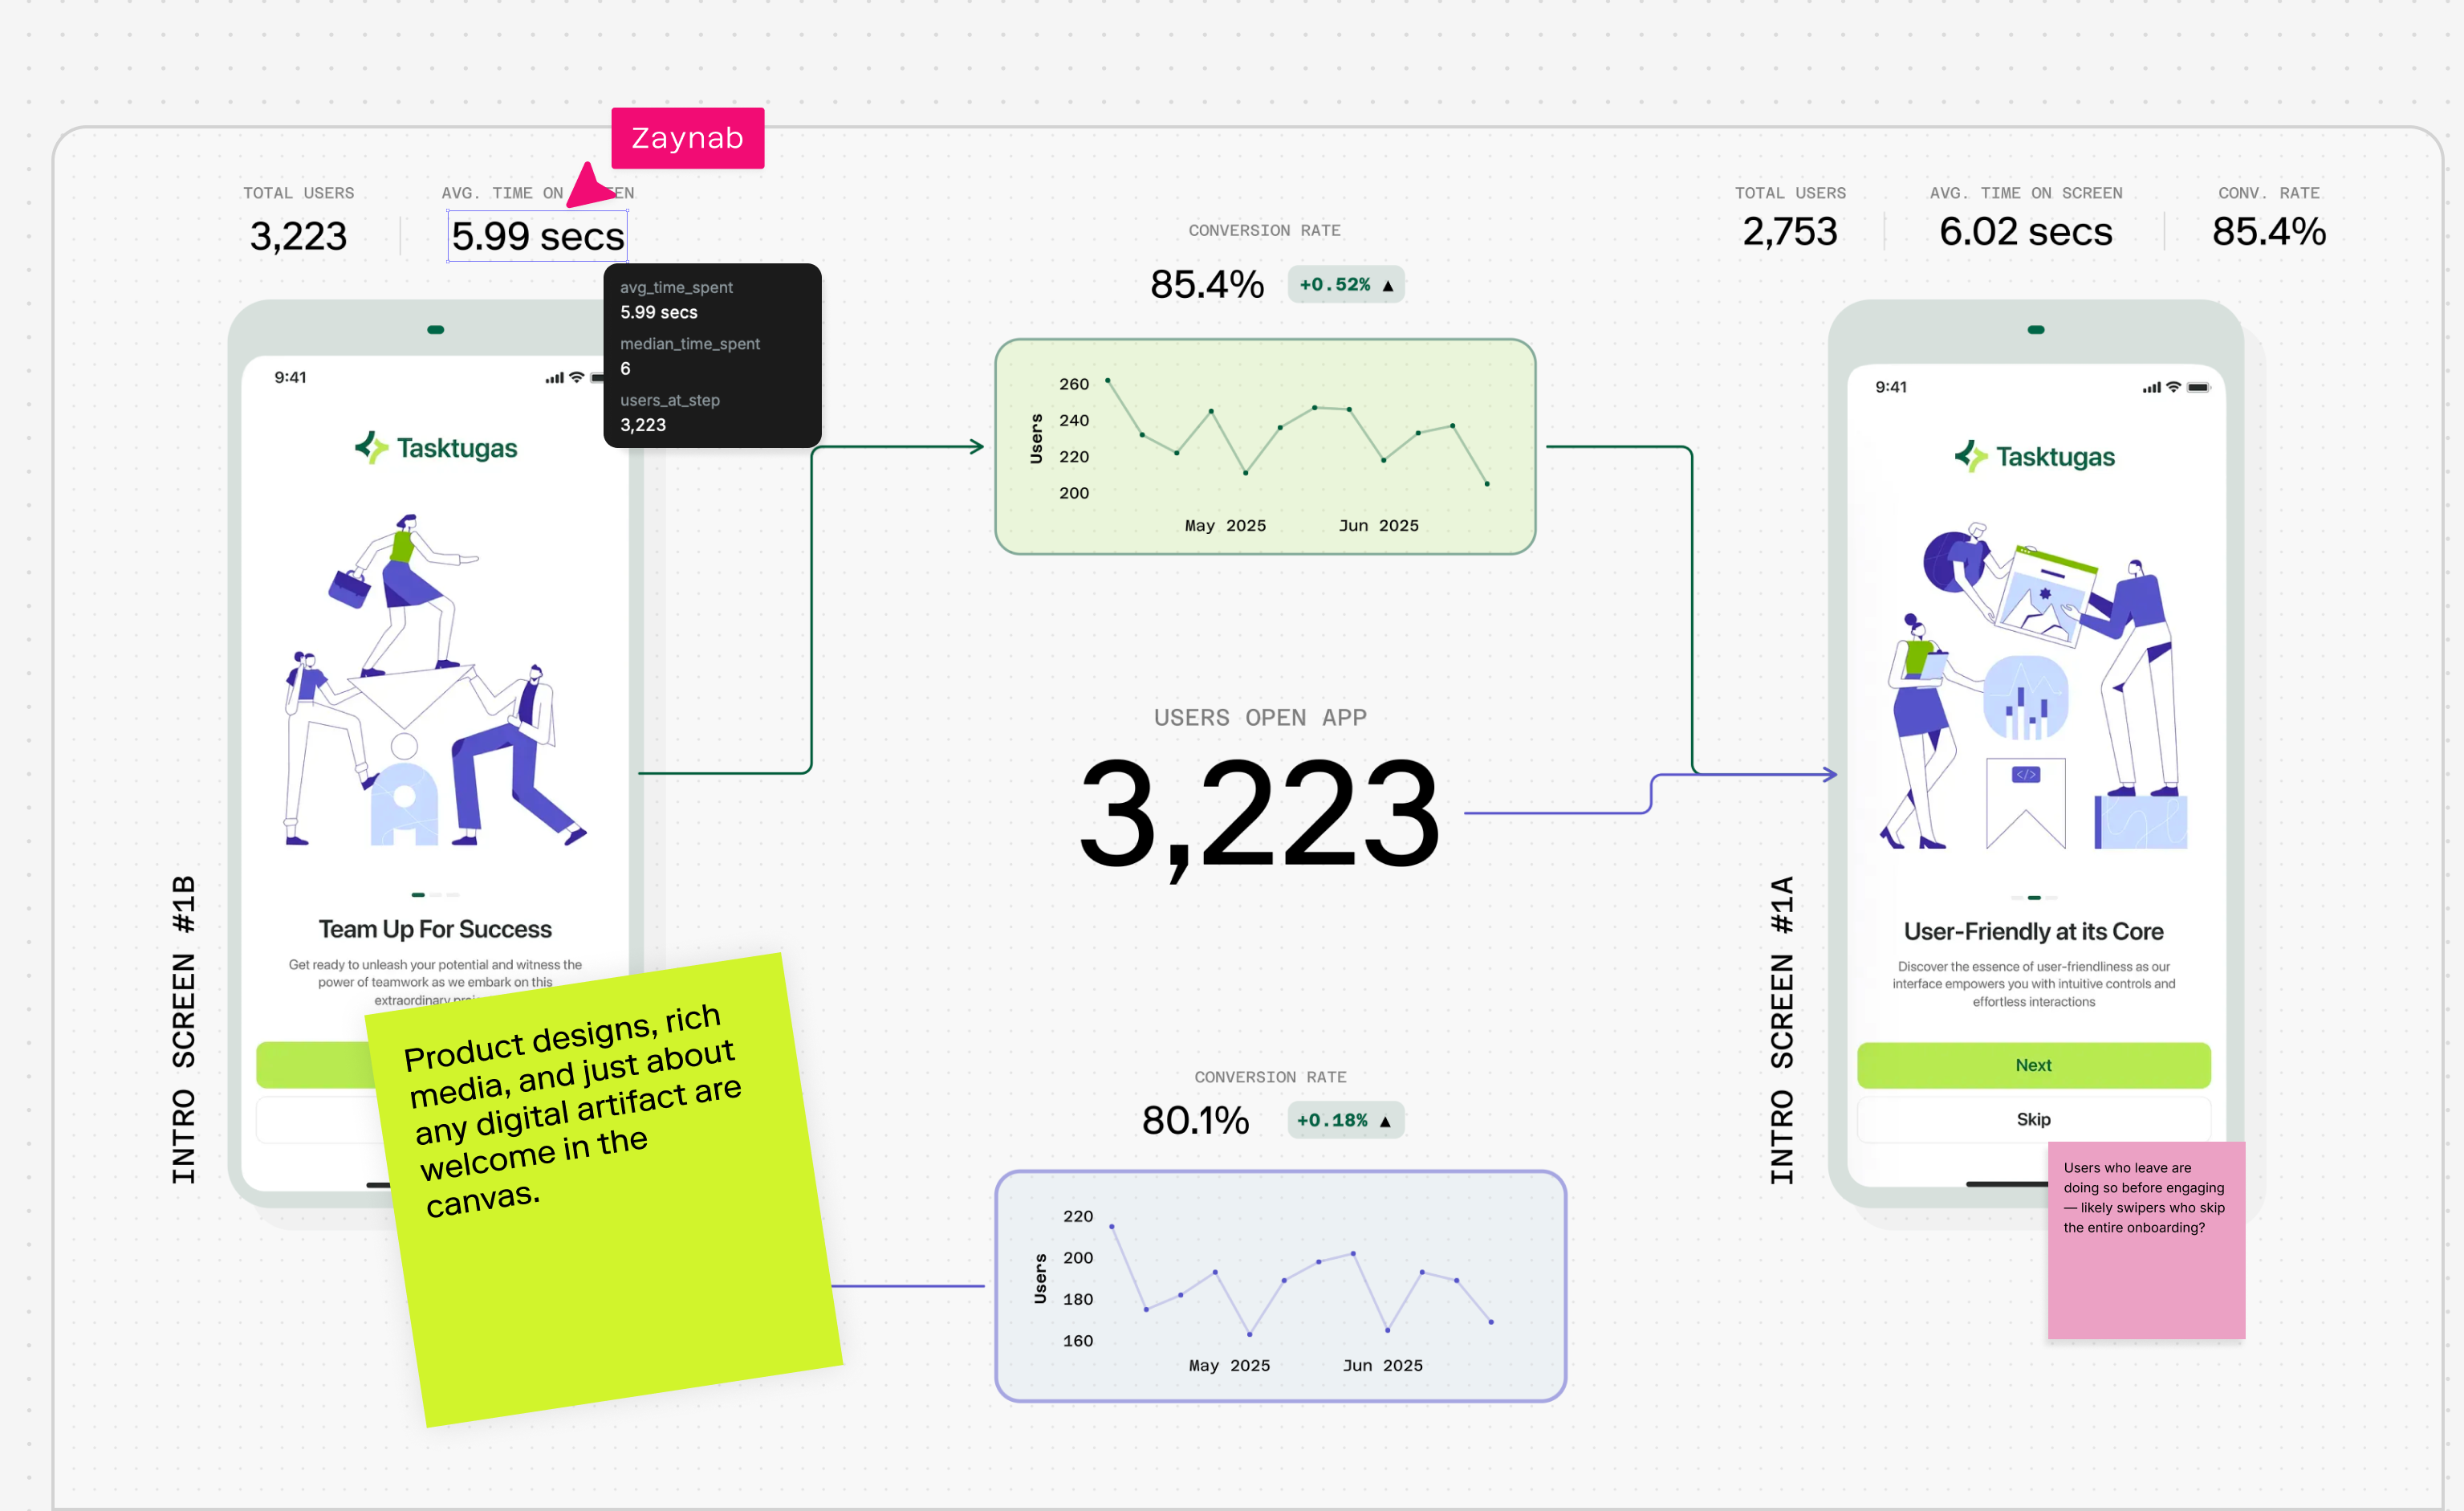
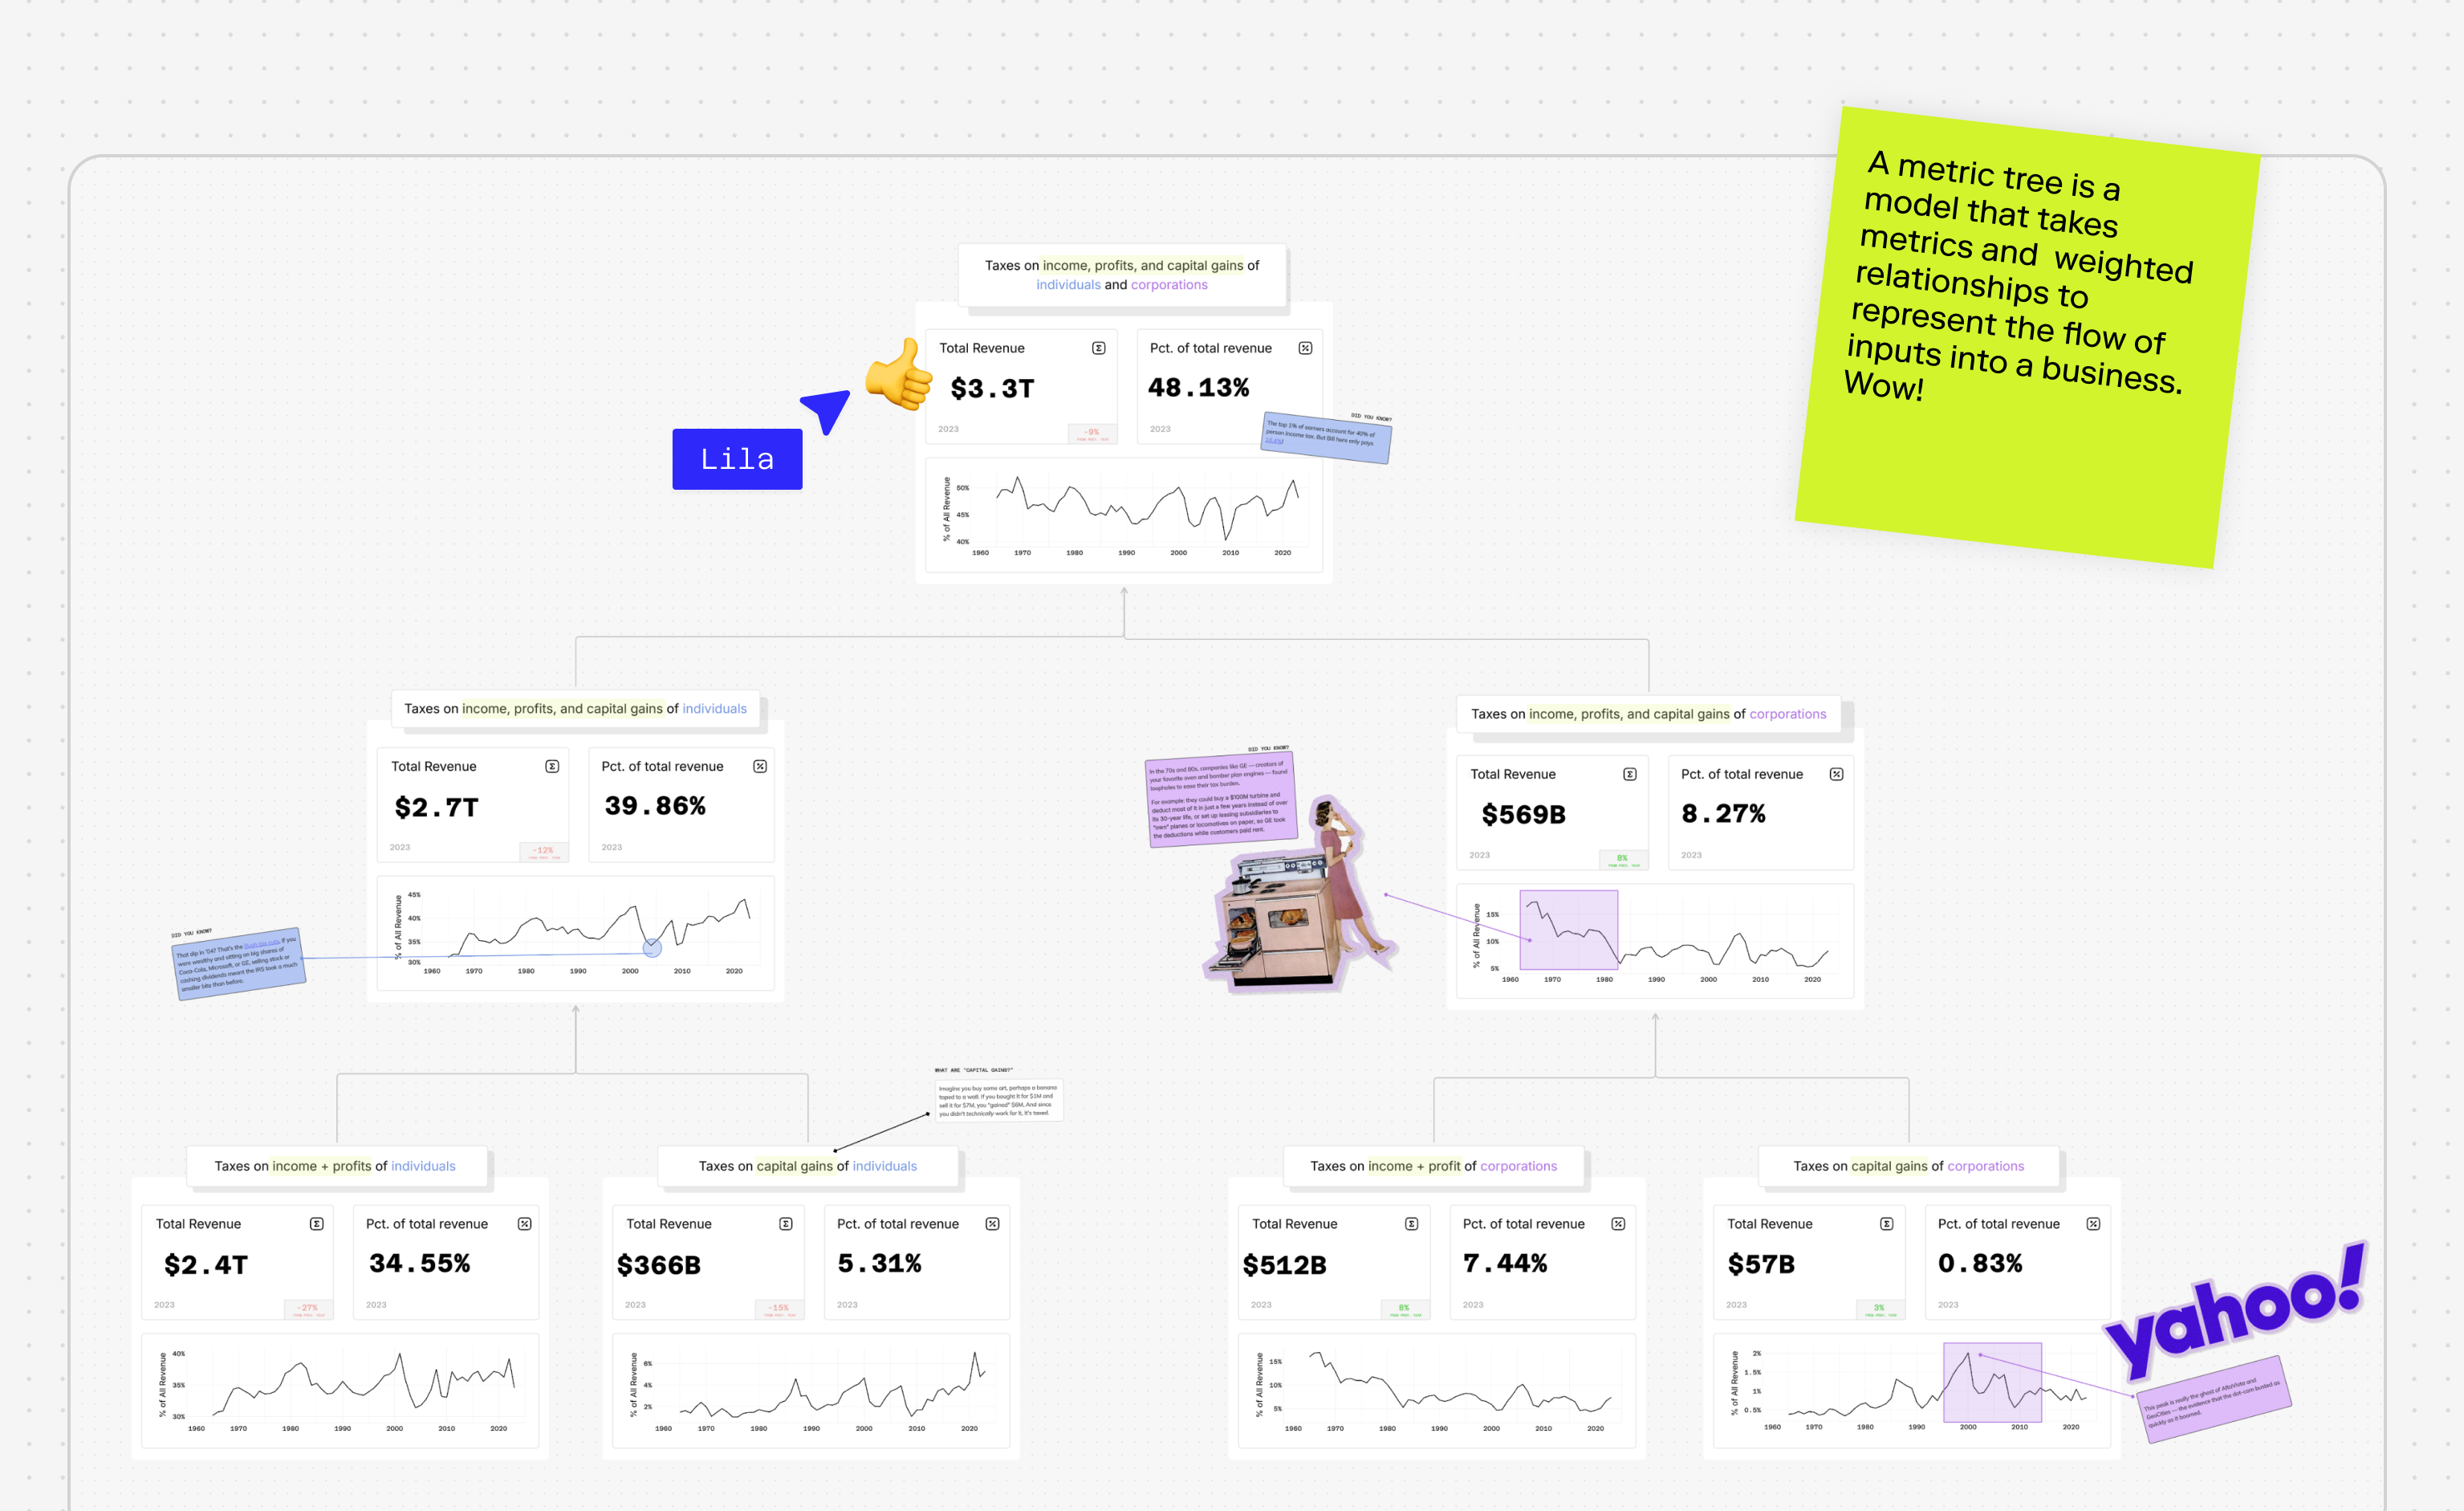
Build reports which show more than just numbers. Create user journeys, metric trees or process-flow maps, all with live data so complex systems feel simple.
“Count’s the perfect tool to intersect creative presenting and data analytics.”
Steph Mathias, Data Scientist, Bumble
Control and governance
All the features you'd expect to keep all your data in a better place
In-memory compute
Use Count's compute layer to take the load off your database, combine data sources and give agents the power they crave →
Public API
Use Count's public API to control every aspect of your workspace or to connect more deeply to your existing tools and workflows →
Role & group permissions
Count has all the permissions layers you need to manage user access plus enterprise-grade authentication like SSO →
Security
All the security you'd expect with full SOC2, HIPAA, GDPR compliance plus multi-tenancy options. →
Telemetry
More than a usage dashboard. Count gives you a full database of all your actions so you can explore any aspect of how Count is being used →
Style sheets
Import your company fonts, colours and design preferences so all outputs are consistent and on brand →


Start the journey away from dashboards to collaborative decision-making
Get value in...
1. Exploration & story telling
Connect your core data sources and use Count's agent to speed up adhoc exploration, data modelling and problem solving.
2. Agentic self service
Build out Count's semantic layer to provide self-service environments for your team to access in the canvas, via Slack or MCP.
3. Goodbye legacy BI
Use Count's API and agent to migrate your key dashboards and user groups to Count as usage of your old BI tool drops.
FAQs
A lot of the messy, fragmented workflow teams rely on today.
SQL queries and notebooks for analysis. Slides for presenting. Spreadsheets for stitching things together. Slack threads for discussion. Count brings all of that into one place - so the work, the thinking, and the decisions stay connected.
Over time, many teams also reduce or replace parts of their BI stack. Instead of maintaining static dashboards, they use Count for more flexible, collaborative ways of understanding and improving the business.
Not exactly.
Most teams start using Count alongside their existing BI tool. Traditional BI is great for tracking metrics and sharing dashboards, but it’s not where people actually work with data. Count fills that gap - giving you a space to explore, analyze and think through problems.
Over time, teams use Count in different ways. Some move more of their reporting into Count, replacing static dashboards with something more flexible and collaborative. Others keep their BI tool for large-scale operational reporting, while using Count for deeper analysis and decision-making.
Count’s agent is powered by leading models from Anthropic, OpenAI and Google.
It works with the context you provide (including your data, logic and previous analysis) and can run queries across the sources you’ve connected. This lets it explore questions, generate analyzes and go deeper, faster than a human alone.
Your data stays under your control. We don’t train models on it, and the agent will always ask permission before accessing external data sources.
Count runs queries in three places: directly on your data warehouse or connected sources, on Count’s servers, and in your browser. This flexible approach lets you combine data across sources while reducing the load on your warehouse.
For many teams, this also lowers costs. By shifting exploratory work out of the warehouse, some customers see significant reductions in compute spend.
Count’s infrastructure is hosted in the US and EU, and you can choose where your data is processed.
Yes.
Count is built with security and compliance at its core. We are SOC 2 compliant and adhere to GDPR requirements, with support for HIPAA where needed.
We apply industry-standard practices across data access, encryption and infrastructure to ensure your data is protected at every step.
For full details, visit our Trust Center at trust.count.co.


