4.8/5
Home

Integrations

Plug Count neatly into your existing data infrastructure

For data teams

Collaborative, AI-driven data exploration and modelling

For product & growth

Faster access to the answers which matter

For leaders

Turning data into an engine of improvement

Pricing

Latest post

Meet the new Count Agent

Meet the new Count Agent

Docs

Guides, references, and API docs

Blog

Opinions, analysis, and the occasional uncomfortable truth about data.

Webinars

Join our experts for deep dives into data analytics and business intelligence

Gallery

Browse ready-to-use canvas templates and try them instantly

Sign in

Where to begin?

Start for free

Spin up a canvas and explore your data — a couple of clicks, no card.

Book a demo

See it live. Bring your questions — we’ll bring the answers.

Still not sure?

Send us a note — we’ll point you the right way.


Data to decisions, faster.

Compare

  • Count vs BI
  • Count vs Notebooks
  • Count vs Chatbots
  • Count vs Hex
  • Count vs Looker
  • Count vs Tableau
  • Count vs Thoughtspot

Learn

  • Blog
  • Webinars
  • SQL tutorials

Legal & security

  • Privacy Policy
  • Terms of Use
  • Cookies Policy
  • Trust Center
  • Security

Social

  • LinkedIn →
  • YouTube →
  • X →

Start with the hard question.

Ask Count anything — we’ll take you straight into a canvas.

Opens sign-up with your prompt ready for Count.

© 2026 Count Technologies Ltd. All rights reserved.

Careers →Book a Demo →
count
← Back to blog home
September 15, 2025

Too Good To Go gets product analytics done 3X faster with Count

Written by The Count Team
Product analyticsAutomation

Too Good To Go accelerates product analytics 3X with Count, enhancing data insights and sharing across teams for smarter, faster decisions.

Too Good To Go connects customers to restaurants and stores that have surplus unsold food so less food goes to waste. With product analytics laid out in canvases on Count, deep product insights can be surfaced quickly.

"Count has not only tripled the speed of our data analysis process but has also simplified the way we organize and share insights. This has been a game-changer in how we approach product analytics and strategy development."  - Dan Redgate, Head of Partner Product Analytics

Unified Product Analytics

Before adopting Count, the product analytics team at Too Good To Go faced considerable challenges centralizing all the data they needed and then sharing it with the broader organization. This often resulted in the manual export of data to Google Sheets sent out via email.

With Count’sintegrations, the team brings together data from their MySQL databases, third-party platforms like Salesforce, and external APIs into a unified analytical environment that everyone can access with a link. This consolidation has drastically reduced the time and complexity associated with data preparation, enabling analysts to spend more time deriving insights.

“What used to be a disjointed and time-consuming process is now seamless and intuitive, allowing us to pull together data from diverse sources effortlessly." - Dan Redgate, Head of Partner Product Analytics

\n

\n                \n                \n                    \n                        \n                            \n                        \n                    \n                \n

\n                    \n                        \n                            \n                                \n                            \n                        \n                        \n                            \n                                \n                                \n                            \n                        \n                        0:00\n                        \n                            /0:16\n                        \n                        \n                        1×\n                        \n                            \n                                \n                            \n                        \n                        \n                            \n                                \n                            \n                        \n                        \n                    \n

\n

\n            \n

Faster Product Analytics

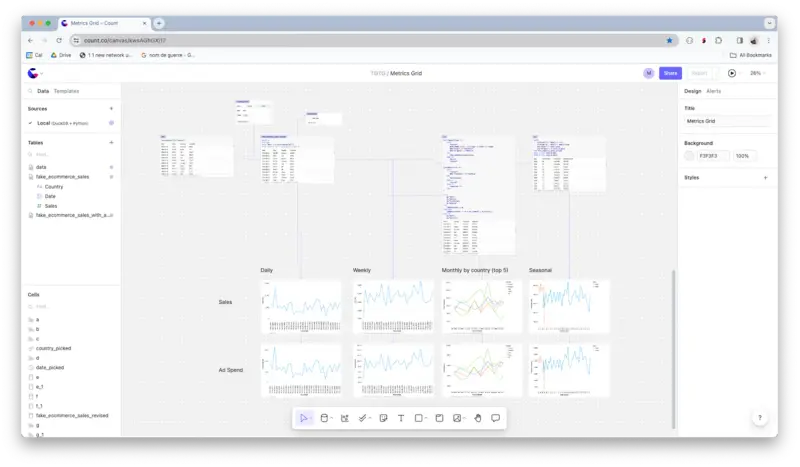
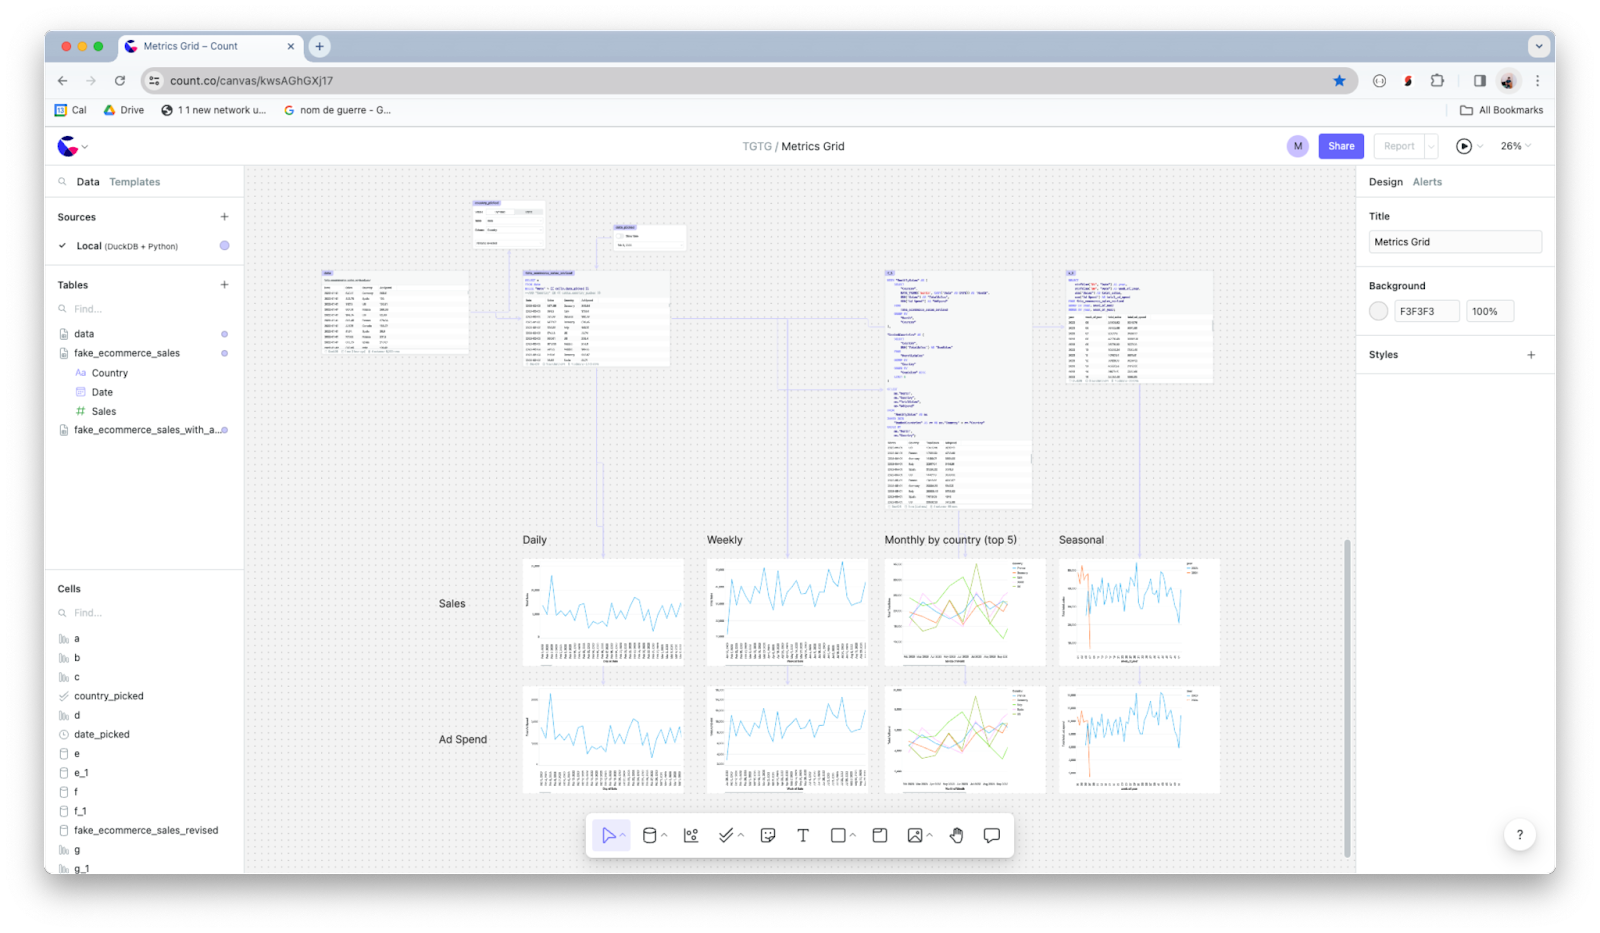
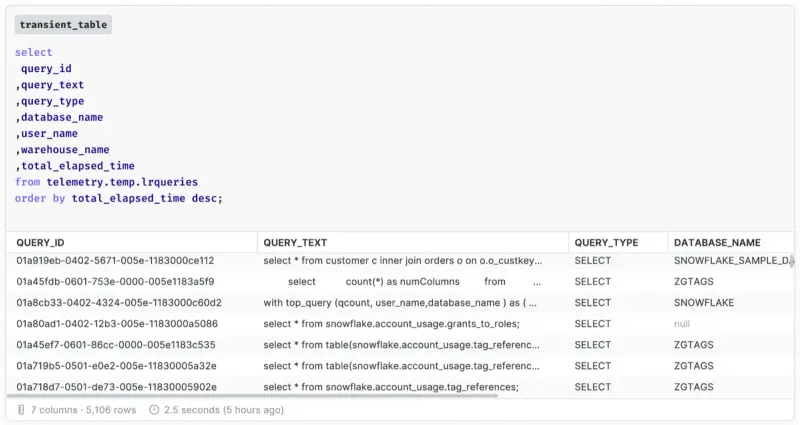
With their previous data stack it was impossible to refresh the data and instantly see how it was updating. With Count product analysts can now build complex queries and models using SQL and Python to visualize the results instantly. They can compose these into reports complete with filters, date pickers, and more to segment and explore their data in real-time.

This allows the team to rapidly iterate on their hypotheses, explore data from multiple angles, and uncover hidden patterns and trends with unprecedented speed.

"The real-time analysis capabilities of Count have been a game-changer for us. We're now able to iterate and explore data dynamically, uncovering insights that were previously out of reach." - Dan Redgate, Head of Partner Product Analytics
Sharable Product Analytics

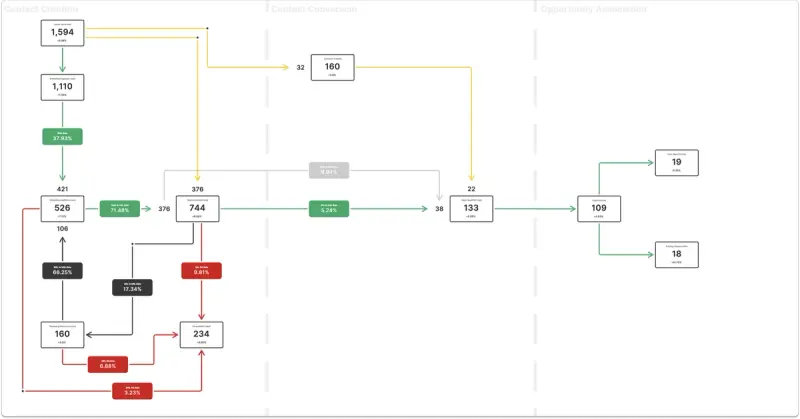
One of Count's most impactful features for Too Good To Go has been how easy it is to share a Count canvas across the product analytics team and beyond. Analysts can share raw analyses with colleagues and polished intuitive dashboards to the entire org. This ensures that insights are not siloed but are instead leveraged across teams to inform product decisions and the overall strategy of the company.

"Count has become an indispensable tool in our analytics arsenal, empowering us to make faster, more informed decisions that drive our mission forward."  - Dan Redgate, Head of Partner Product Analytics

\n

\n                \n                \n                    \n                        \n                            \n                        \n                    \n                \n

\n                    \n                        \n                            \n                                \n                            \n                        \n                        \n                            \n                                \n                                \n                            \n                        \n                        0:00\n                        \n                            /0:07\n                        \n                        \n                        1×\n                        \n                            \n                                \n                            \n                        \n                        \n                            \n                                \n                            \n                        \n                        \n                    \n


\n

\n            \n