Count vs Tableau
Written by The Count Team
"Count vs Tableau: Streamline analytics with Count's collaborative, flexible approach. Pair with Tableau for powerful insights and cost savings. Discover modern data solutions today!"
Tableau has been the defacto analytics front end for people looking to deliver beautiful dashboards for over a decade, and for good reason. However, many feel it’s become overly complex and cumbersome for the type of rapid, exploratory analysis favored by top data teams today. As the 2020s are in full swing, new approaches and new tools are emerging with a fresh approach to delivering value with data, centered on collaboration, flexibility and trust. In this article we’ll examine how Count and Tableau address the analytics challenges of today while showing where they compete with or complement one another, and how you can use the two together to drive action and save money.
The challenges of Tableau
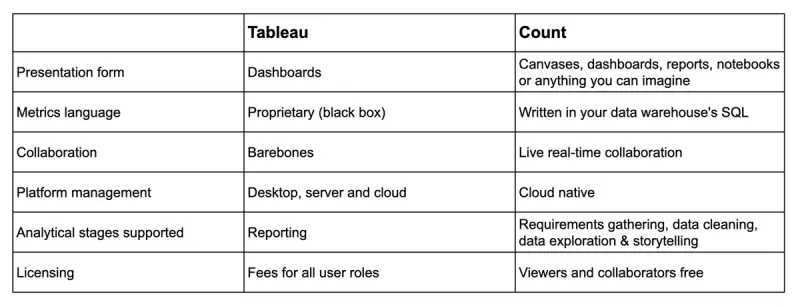
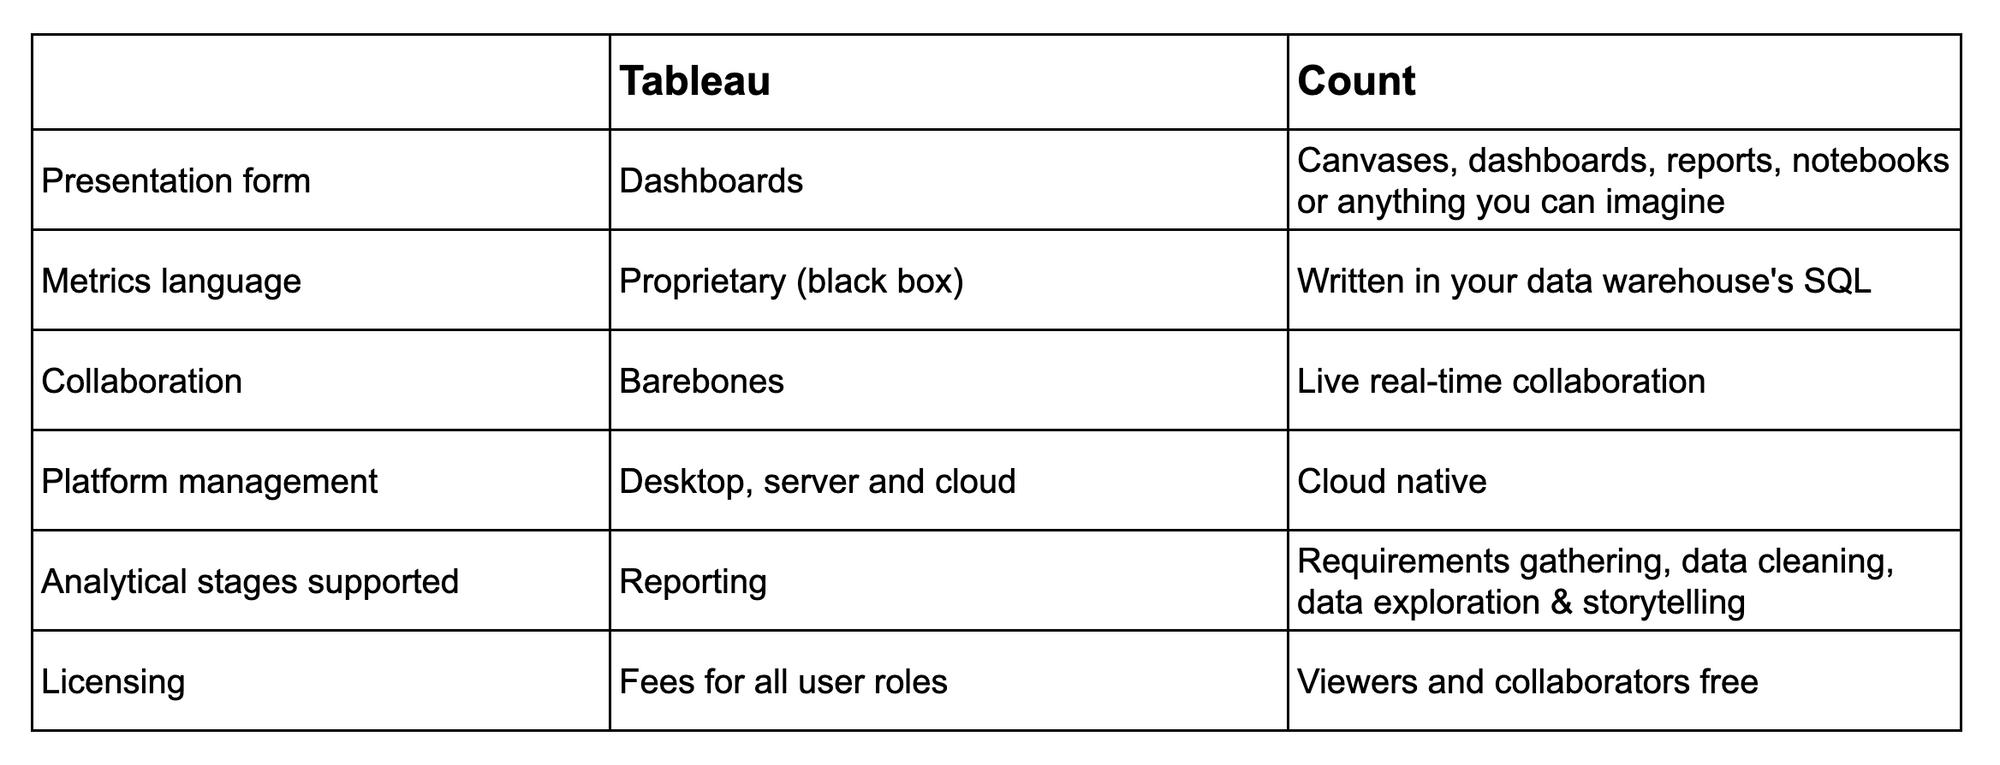
On the surface Tableau and Count look like very similar tools - both produce great looking dashboards and reports based on clean, modern visualizations. But when you look past the glossy front end you see that they operate on very different philosophies of how to deliver value with analytics.
Everything about Tableau is designed to churn out great looking dashboards and visualizations as quickly as possible. This capability alone was a revelation when Tableau first took the data scene by storm in the early 2010s. It’s very effective if the questions are clear, the data is clean and you don’t need to iterate or evolve your analysis over time.
However when things aren’t so clear Tableau requires that you do a ton of analysis work in a SQL IDE or involve the data engineering team to prep data before you can do any analysis at all. In fact a majority of data analysts spend over half their time working outside their main BI tool. Ultimately Tableau is a one-way street of insight because it’s too rigid. It’s bad when you want to involve multiple people to create a feedback cycle driving change in your analytics and business. In fact, the most common result of trying to use Tableau to really solve a problem or discuss outcomes is that you export CSVs into Excel for further analysis or copy-paste screenshots to PowerPoint to talk about it.
How Count modernizes analytics
Count is different. It’s built for situations where the questions aren’t clear, where you need to combine the expertise of many people, and where you want to rapidly iterate to improve business outcomes. Let’s take a look at how it does this:
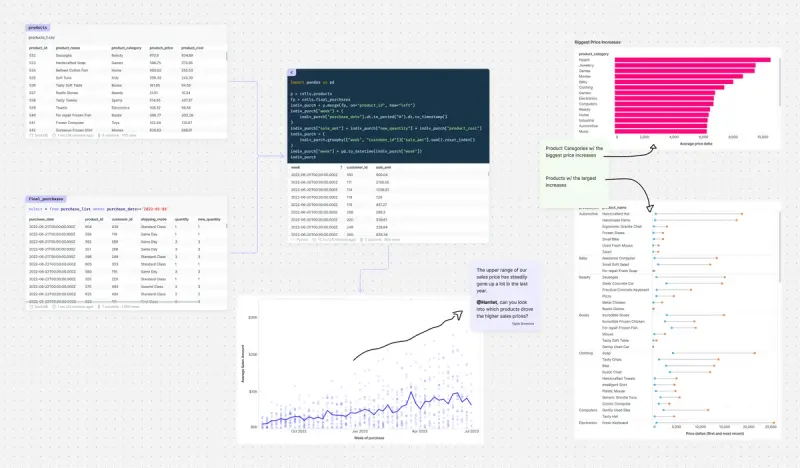
- Count’s intuitive, 2D interface invites problem solving by giving you the visual space to lay things out however you want.
- Because Count contains a SQL IDE, visualization builder, collaboration and presentation in the same place, it’s home to your entire workflow, not just reporting.
- Count is a multiplayer canvas experience. Data and business people can work together in the same realtime session to solve problems.
- Count uses standard SQL to build models, not a proprietary language. Your analysis and metrics are never locked into a proprietary BI layer, and you have full transparency into the assumptions and logic behind any decision.
Count is the home for your entire data problem solving process. Analysts and data engineers can stay in flow as they work alone or together. You can then share the solution in Count, or easily move your analysis to other places including data engineering and AI/ML via Count’s easy SQL export. Count is more than the place you visualize answers - it’s where teams come together to make things happen.
Count + Tableau = a great team
Now let’s be realistic - Tableau is a great dashboard tool, it’s well understood by your analysts and you aren’t getting rid of it anytime soon. Nor should you! The reality is that Count and Tableau form a dynamic insight generation and distribution team. Consider a few of our clients who have done exactly this:
Madhav at Fairmoney
Madhavuses Count to build the types of deep analysis that aren’t possible when you’re restricted to the dashboard form factor. His metrics tree forms a visual ‘single source of truth’ that provides transparent and trusted data to the entire organization. Count drives the last mile of analytics at Fairmoney, ‘The development cycle in Tableau is challenging - you’ll get good dashboards but to get good context - to tell good stories - you need to devote too many resources. It doesn’t justify itself for the last mile or ad hoc.’
Phillip at Omnipresent
ForPhillip, Count is the place where real data collaboration takes place. Data engineers, analysts and business experts work together to solve complex problems. Answers are then presented in Count or used to drive important data processes elsewhere. ‘The incredible thing about Count is that once you’ve done an analysis, joined tables together, done some filtering and aggregation, you can take all of that code and literally just right click and say ‘copy compiled SQL’ and deploy that code to dbt or wherever you want, because Count uses the correct SQL syntax for your database. Your logic is never locked within Count like it is in Tableau.’
Madhav and Phillip mix Count and Tableau in a way that play to each tool’s strength: Count is used to solve problems and build creative outputs to solve specific problems, while Tableau provides industrial grade dashboard distribution for operational BI. The two reinforce one another.
Solve problems and save money
Customers who pair Count with Tableau not only supercharge their analytics, they also save money. By migrating data engineering, exploration and modeling tasks to Count, you can scale back your Creator and Explorer licenses on Tableau. This lets you maximize Tableau’s value as an insight distribution machine while saving cash in the process.
In fact, Count and select consulting partners are offering a free evaluation of your Tableau licensing to show how you can save money and deliver better insights faster by incorporating Count into your analytics practice today. Get in touch!
Talk to Count
![10 Best Business intelligence Tools for Collaborative Data Analysis and Business Improvement [2025]](https://cdn.sanity.io/images/8potcy1y/production/5208d5bf4ac7bfe1101b1f0cb63d6489fa6886e7-3061x1522.png?w=800&fm=webp&q=75)