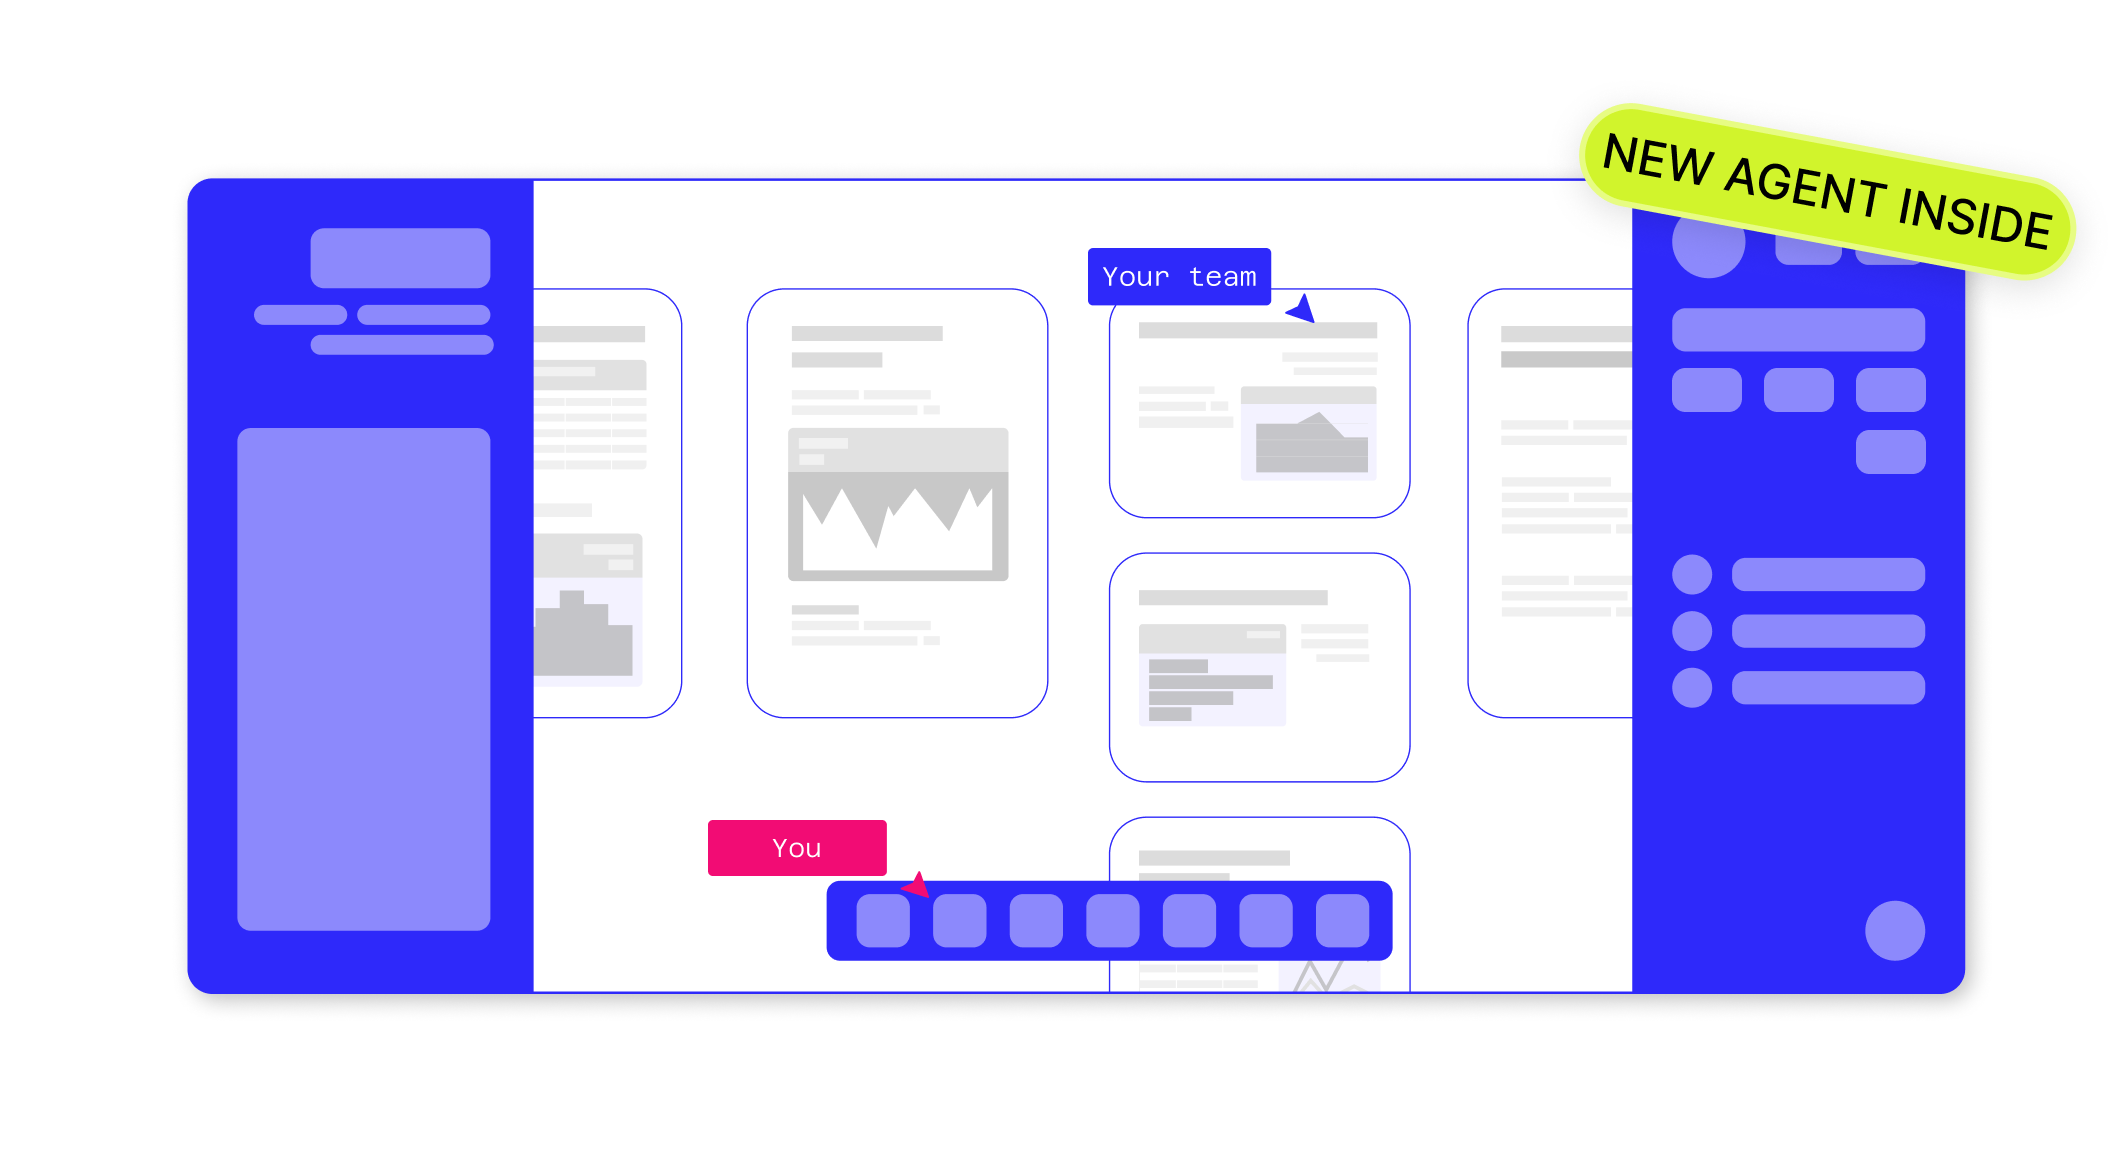
Meet the new Count Agent
Written by Oliver Hughes
Oliver Hughes shares how the new Count Agent creates polished charts, auto layouts, and web-powered analysis to make deep research faster and more accessible.
Today we're launching a new version of the Count Agent.
It's a big step towards making Count the best place for analytics and deep research. More people can dig into data, and what you produce looks better than ever, right on the canvas.
What's new? ✨
Outputs that look great by default. The agent is now a much better designer. It builds clean charts, polished visuals and even slide decks without you tweaking anything. Use it for fine detail work, like fixing the formatting of one chart, or hand it a full analysis in one go.
Auto layout. Everything in a frame can now be arranged and ordered in a grid-like structure, whether you're building frames manually or the agent is. This massively improves how cleanly information is laid out, no matter how deep you go.
Data from the web. The agent can now bring in external information from the web. Point it at a specific page or ask it to search. Analyse competitor trends in depth, or blend market context from the web with your internal numbers for a more complete picture. (Note: this feature is turned off by default in existing workspaces. Learn more in our docs.)
By themselves these are all big changes in how easy it is to use Count, but combined we think they produce something very special, which is easier shown than explained. I really recommend watching this video from Chas where he works through a real business problem using the new agent.
The new agent makes Count faster and more accessible for you and your wider team. But the same collaboration, transparency and space to think that you already love still remains.
A note on AI usage
AI usage stays in beta throughout August, so use the agent as much as you like. If you run out of credits, just message us and we'll top you up. We'll be introducing usage-based AI pricing towards the end of August, and we'll share details well before anything changes.
There's plenty more coming, including support for more document types and agent skills. In the meantime, jump in, try it, and message us with any questions.