
Customer acquisition cost (CAC)
AI for data and analytics · Facts checked 23 October 2026
Customer acquisition cost is what you spend to win one new customer. Spend £90,000 on sales and marketing in a quarter, win 150 new customers, and your CAC is £600. It counts paying customers, not leads or trials.
What is customer acquisition cost (CAC)?
Marketing says customer acquisition cost is £180. Finance says £640. They're looking at the same quarter and the same customers. One is counting ad spend; the other is counting everything it took to win them.
It differs from Cost Per Acquisition (CPA) in two ways. CPA counts conversions, which may be leads or trials; CAC counts paying customers. And CPA is usually one channel's ad spend, where CAC is usually all of sales and marketing.
CAC means little on its own. Set it against Customer Lifetime Value (CLV) to see whether customers are worth what they cost, and against CAC Payback Period to see how long they take to earn it back. When CAC rises, Lead-to-Opportunity Conversion Rate is often where the funnel is leaking.
How to calculate CAC
Formula: CAC = sales and marketing costs in a period ÷ new customers won in that period
One quarter, four CACs
A B2B software company, one quarter. The figures are invented to show the arithmetic, but every line is a choice real teams make.
| What you count | Cost | New customers | CAC |
|---|---|---|---|
| Ad spend, against customers the CRM credits to paid channels | £27,000 | 60 | £450 |
| Ad spend, against all new customers | £27,000 | 150 | £180 |
| All marketing: ads, tools, agency, marketing salaries | £58,000 | 150 | £387 |
| Sales and marketing, fully loaded | £96,000 | 150 | £640 |
The £180 is the flattering one. It divides paid spend by customers who came from everywhere, referrals and organic search included. The £640 is what finance sees. The £450, paid spend against paid customers, is the fair number for judging the ad budget.
The four choices inside the number
- Which costs. Ad spend alone, or tools, agencies, salaries and commission too. Fully loaded is the number for unit economics; paid is the number for the ad budget. Say which.
- Which customers. New paying customers only: not free sign-ups, reactivations or upgrades.
- Blended or by channel. Blended CAC divides all costs by all customers. Paid CAC divides paid costs by paid customers, which needs an attribution rule to say which customers paid channels won.
- Lag. In B2B, a deal that closes this quarter may come from last quarter's spend. A quarter is safer than a month, and some teams lag the spend by their average sales cycle.
See which costs and customers your CAC counts
Connect HubSpot and your ad platforms, ask Count for CAC in plain English, and open the Reasoning Chain behind it: which costs, which customers, which attribution rule.
Asking Claude or ChatGPT for your CAC
Ask an AI for your CAC with an ad export and a CRM export attached, and you'll most likely get the £180 version: ad spend divided by every new customer it can find. It's the easiest division to make from those two files, and nothing in the answer will say it's the flattering one.
A two-minute check
After any AI-calculated CAC, ask:
- "Which costs are in the numerator? Is anything besides ad spend included?"
- "Which customers are in the denominator: every new customer, or only those credited to paid channels? By what rule?"
- "Are free sign-ups, reactivations or upgrades counted as new customers?"
- "Does the spend period match the period the customers closed in?"
The workflow below takes the paid version further. It puts Google Ads spend against the deals HubSpot says closed, campaign by campaign, using a matching rule you can see. Divide each campaign's spend by its deals and you have paid CAC per campaign.
Workflow 1
AI for marketing attribution: platform ROAS against CRM revenue
Ad platforms report the value they were told a conversion was worth. HubSpot knows which deals closed. Putting the two side by side by campaign is usually where the month's real finding is: the campaign that looks best in Google Ads is often not the one that closed revenue. HubSpot's own revenue attribution reports need Marketing Hub Enterprise (HubSpot Knowledge Base); this workflow gets a first answer on any tier.
Uses
 Google Ads
 HubSpot
Before you run it
- Google Ads and HubSpot connected
- The HubSpot property your team uses for a deal's original campaign (for example the contact's Original Traffic Source drill-down), named in the prompt
- A date range long enough for deals to close: a quarter is safer than a month
Show the full prompt (23 lines)Hide the prompt
Compare Google Ads ROAS with CRM revenue by campaign for [quarter].

1. From Google Ads, pull spend and conversion value by campaign for the
   period. Print the conversion window and whether conversion value rules
   are active.
2. From HubSpot, find closed-won deals created in the period whose
   associated contact has Original Traffic Source = Paid Search, and
   read [campaign property] to match each deal to a Google Ads campaign.
   Page through all results; report how many you retrieved and confirm
   none were left.
3. Build one table: campaign, spend, platform conversion value, platform
   ROAS, HubSpot closed-won amount, CRM ROAS, number of deals. ROAS as a
   ratio from totals.
4. List deals in other currencies separately with their original amount.
   Don't convert them.
5. List campaigns with spend but no matched deals, and deals with a
   campaign value that matches no Google Ads campaign.
6. Under the table, name the campaign with the largest gap between
   platform and CRM ROAS in each direction, with both numbers.
7. Show the GAQL and the HubSpot search filters you used.

Don't call either ROAS "true". They measure different things; say what
each one counts.
 Google Ads against HubSpot closed-won, Q3ArtifactExample from sample data
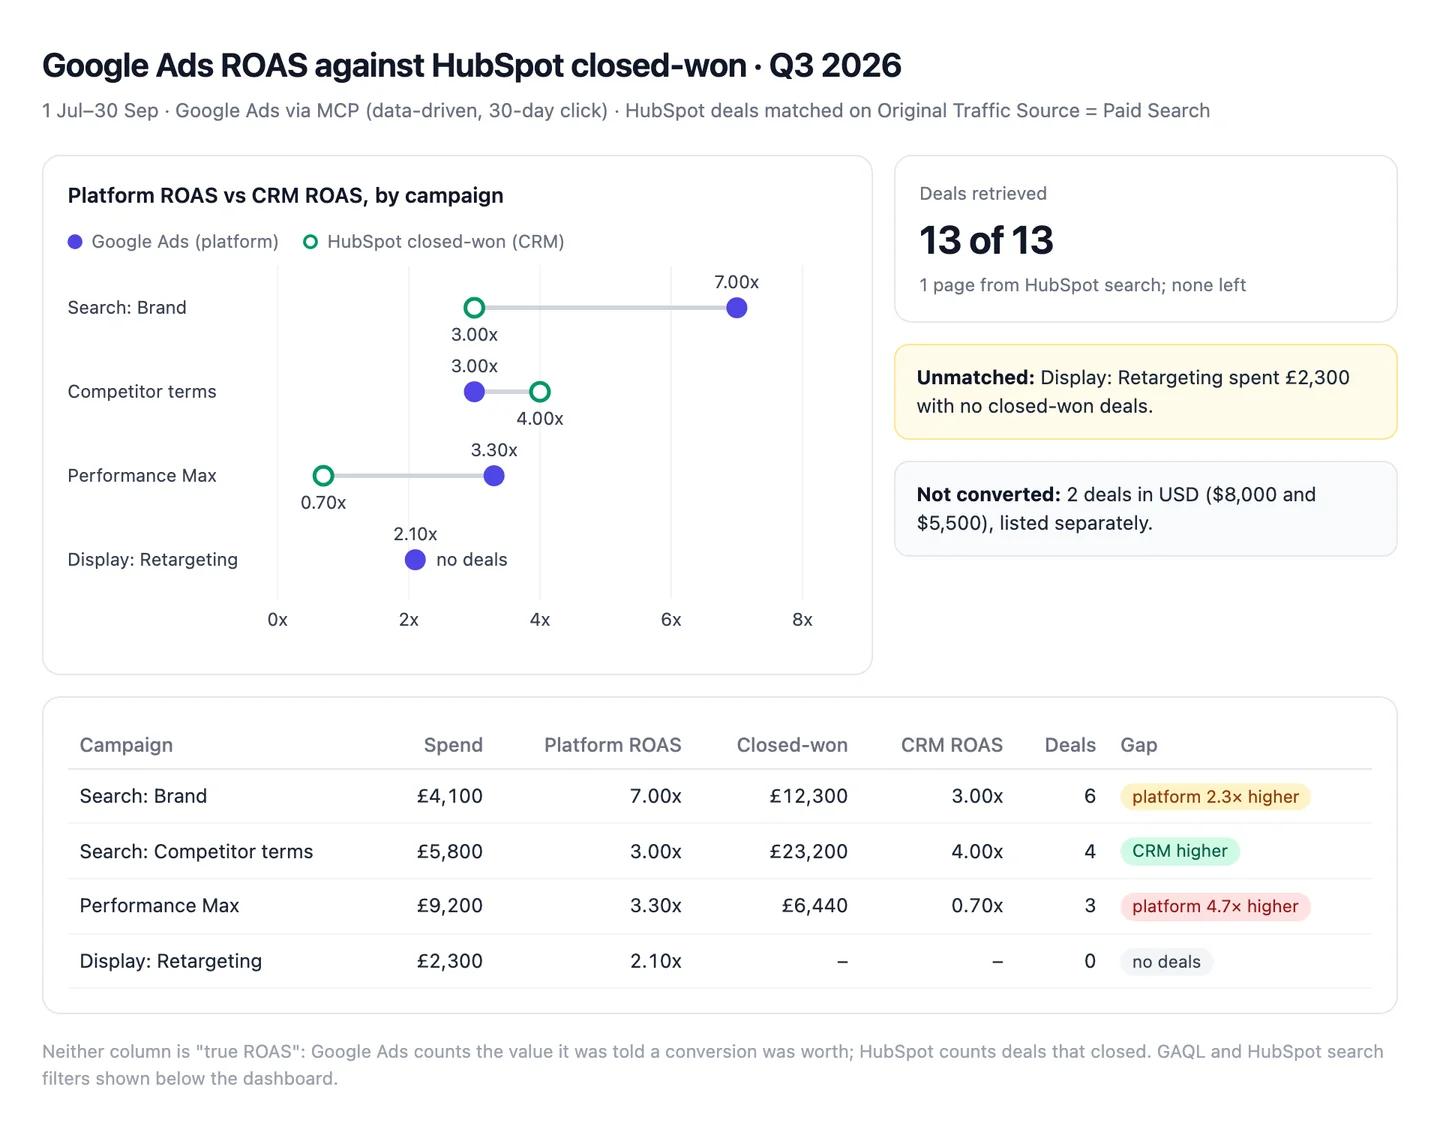
The numbers in this example
| Campaign | Spend | Platform ROAS | Closed-won | CRM ROAS | Deals |
|---|---|---|---|---|---|
| Search: Brand | £4,100 | 7.00x | £12,300 | 3.00x | 6 |
| Search: Competitor terms | £5,800 | 3.00x | £23,200 | 4.00x | 4 |
| Performance Max | £9,200 | 3.30x | £6,440 | 0.70x | 3 |
| Display: Retargeting | £2,300 | 2.10x | none | none | 0 |
- Largest gaps: Performance Max claims 3.30x and closed 0.70x. Brand claims 7.00x and closed 3.00x. Competitor terms is the one campaign that closed more than Google Ads reports.
- Not converted: 2 deals in USD ($8,000 and $5,500), listed separately.
- Unmatched: 1 campaign with spend and no deals (Display: Retargeting).
 AI output auditRuns on every answer
Performance Max closed 0.70x Assumption against the 3.30x Google Ads reports, the biggest gap of any campaign. Brand's platform ROAS is inflated by people who'd have bought anyway Model knowledge. All 13 matching deals were retrieved Citation from HubSpot.
Assumption
Performance Max closed 0.70x
Deals were matched to campaigns by the contact's first traffic source. A deal that came through Performance Max but first arrived from a Brand search counts as Brand, so Performance Max may look worse than it is.
Model knowledge
Brand ROAS is inflated by people who'd have bought anyway
A common belief, not something in your data. Fine as a question to test; not a finding to put in the board pack.
Citation
13 of 13 deals retrieved
HubSpot returned every matching deal, so none are missing from the totals.
What's a good CAC?
A good CAC is one a customer pays back, comfortably and soon. The first check is payback:
Formula: CAC payback (months) = CAC ÷ (monthly revenue per customer × gross margin)
At a £640 CAC, £80 a month per customer and an 80% gross margin, payback is £640 ÷ £64 = 10 months.
The second is lifetime value. A lifetime value of about three times CAC is often quoted for subscription businesses. Treat it as a starting point, not a target: lifetime value is an estimate, and it carries assumptions of its own.
We don't publish average CAC by industry. Published figures mix fully loaded and paid-only CAC, B2B and consumer, and different definitions of a customer. Your own payback period is a better benchmark.
Why is my CAC rising?
Check the denominator first. Fewer new customers raises CAC as surely as more spend. If spend is flat, find where the funnel leaked: lead volume, Lead-to-Opportunity Conversion Rate or win rate.
Costs rose that don't scale with customers. A new hire, a tool, an event. Fully loaded CAC jumps for a quarter or two before the customers arrive.
Paid channels got pricier. A rising Cost Per Acquisition (CPA) at the top of the funnel feeds through to CAC a sales cycle later.
The mix moved. If referrals and organic slowed, blended CAC rises even though paid CAC didn't change. That's why it's worth tracking both.
Timing. Spend this quarter, deals next quarter. A one-quarter spike that reverses is often just lag.
How to reduce CAC
Move budget towards the lowest paid CAC, not the lowest CPA. A channel with cheap leads that never close is expensive.
Fix conversion between stages. A higher lead-to-opportunity rate lowers CAC without touching spend.
Grow the channels that cost little per customer. Referrals, organic search and customers bringing in colleagues all lower blended CAC.
Shorten the sales cycle. Fewer touches per deal means less sales time per customer.
Judge it against what customers are worth. A higher CAC for customers with a much higher Customer Lifetime Value (CLV) can be the better trade. CAC Payback Period tells you whether you can afford it.