
Return on ad spend (ROAS)
AI for data and analytics · Facts checked 23 October 2026
Return on ad spend is the revenue your ads bring in for each pound or dollar you spend on them. Spend £1,000, attribute £4,000 of sales to the ads, and your ROAS is 4. You'll see that written as 4x, 4:1 or, in Google Ads' Target ROAS setting, 400%.
What is return on ad spend (ROAS)?
Google Ads says a campaign returned 4.5. Finance says the same campaign barely broke even. Both can be right, because ROAS is one division with four decisions hidden inside it.
Google defines it as "total conversion value divided by total spend" (Google Ads Glossary). Note the wording: conversion value, not revenue. Conversion value is whatever your tracking sends, which may include tax and usually comes before refunds, and Google lets you adjust it further with conversion value rules.
ROAS is not ROI. ROAS uses revenue; Campaign ROI uses profit. A campaign can post a ROAS of 3 and still lose money if your margins are thin, which is why most of this page is about margin.
ROAS rarely moves on its own. Conversion Rate usually explains why it changed, Cost Per Acquisition (CPA) tells you what each customer cost, Cost Per Click (CPC) shows whether the auction got pricier, and Customer Lifetime Value from Ads tells you whether a low first-order ROAS is a problem at all.
How to calculate ROAS
Formula: ROAS = conversion value from ads ÷ ad spend
A ROAS of 2.5 means £2.50 back for every £1 spent. If you sell on Amazon you'll see ACoS instead, which is the same ratio upside down: ROAS = 1 ÷ ACoS, so an ACoS of 25% is a ROAS of 4.
The division is the easy part. The arguments are about what goes on top and what goes underneath.
One campaign, four ROAS figures
Here's a month of paid search for an online shop. The figures are invented to show the arithmetic, but every line is a choice real teams make. Ad spend is £8,000 throughout.
| What you count as value | Value | Result |
|---|---|---|
| Platform-reported conversion value, including view-through | £36,000 | ROAS 4.5 |
| Click-through conversions only | £30,000 | ROAS 3.75 |
| Click-through, excluding 20% VAT and refunds (£3,000 inc. VAT) | £22,500 | ROAS 2.8 |
| Gross profit on that, at a 40% margin | £9,000 | 1.1 profit on ad spend |
Same campaign, same month. The 4.5 is what the ad platform shows you. The 2.8 is much closer to what your finance team sees. At a 40% margin the campaign made £1,000 after ad costs: a profit, but not the triumph 4.5 suggests.
The four choices inside the number
- Which conversions count. Each ad platform counts sales within its own attribution window. Meta's default is 7-day click, 1-day view and 1-day engagement, so someone who saw an ad, or watched five seconds of a video, and bought the next day without clicking still counts. Run ads on two platforms and the same sale can be claimed twice.
- What counts as value. Gross or net of tax, before or after refunds, revenue or margin. There's no standard; just say which.
- Which costs. Media spend only, or agency fees and creative production too. Including them gives a lower, more honest number. Either is fine as long as you compare like with like.
- How you add up time. This one catches people out (see below).
Averaging ROAS is the quiet mistake
On Monday you spend £100 and make £1,000: a ROAS of 10. On Tuesday you spend £900 and make £900: a ROAS of 1. The average of the two daily figures is 5.5. Your actual ROAS for the two days is £1,900 ÷ £1,000 = 1.9.
Never average a ratio across rows. Add up the value, add up the spend, then divide. It sounds obvious written down. It's much less obvious inside a spreadsheet with 90 rows of daily figures and an AVERAGE() at the bottom.
See why your ROAS is 4.5 and not 2.8
Connect your ad platforms and order data, ask Count in plain English, and open the Reasoning Chain behind every number: which conversions, which costs, which definition.
Asking Claude or ChatGPT for your ROAS
Paste a campaign export into Claude or ChatGPT, ask for your ROAS, and you'll get a number back in seconds. It will usually look sensible. What it won't tell you, unless you ask, is which of the four choices above it made to get there.
That's the real risk with AI and metrics. Getting a division wrong is rare. Picking a definition without saying so is common, and the answer reads just as confidently either way. We've written about this kind of error in the hidden AI hallucination: an answer that is plausible, matches what you expected, and so never gets checked.
A two-minute check
After any AI-calculated ROAS, ask four follow-up questions:
- "Which column did you use as revenue, and does it include tax or refunds?"
- "Did you divide total value by total spend, or average a ratio across rows?"
- "Which conversions are included, and over what attribution window?"
- "What would the result be using gross profit instead of revenue?"
If it can't answer the first two from the data you gave it, it was guessing. If the answer to the fourth changes your decision, you were never really asking about ROAS.
In Count, a Reasoning Chain shows these choices without you having to ask: every step from your raw spend and conversion data to the final figure, with the columns, filters and assumptions it used. You can see why the number is what it is, and challenge the step you disagree with.
The workflow below goes a step further. It puts Google Ads ROAS next to the revenue HubSpot says actually closed, campaign by campaign, and the Count audit under it shows what still needs checking.
Workflow 1
AI for marketing attribution: platform ROAS against CRM revenue
Ad platforms report the value they were told a conversion was worth. HubSpot knows which deals closed. Putting the two side by side by campaign is usually where the month's real finding is: the campaign that looks best in Google Ads is often not the one that closed revenue. HubSpot's own revenue attribution reports need Marketing Hub Enterprise (HubSpot Knowledge Base); this workflow gets a first answer on any tier.
Uses
 Google Ads
 HubSpot
Before you run it
- Google Ads and HubSpot connected
- The HubSpot property your team uses for a deal's original campaign (for example the contact's Original Traffic Source drill-down), named in the prompt
- A date range long enough for deals to close: a quarter is safer than a month
Show the full prompt (23 lines)Hide the prompt
Compare Google Ads ROAS with CRM revenue by campaign for [quarter].

1. From Google Ads, pull spend and conversion value by campaign for the
   period. Print the conversion window and whether conversion value rules
   are active.
2. From HubSpot, find closed-won deals created in the period whose
   associated contact has Original Traffic Source = Paid Search, and
   read [campaign property] to match each deal to a Google Ads campaign.
   Page through all results; report how many you retrieved and confirm
   none were left.
3. Build one table: campaign, spend, platform conversion value, platform
   ROAS, HubSpot closed-won amount, CRM ROAS, number of deals. ROAS as a
   ratio from totals.
4. List deals in other currencies separately with their original amount.
   Don't convert them.
5. List campaigns with spend but no matched deals, and deals with a
   campaign value that matches no Google Ads campaign.
6. Under the table, name the campaign with the largest gap between
   platform and CRM ROAS in each direction, with both numbers.
7. Show the GAQL and the HubSpot search filters you used.

Don't call either ROAS "true". They measure different things; say what
each one counts.
 Google Ads against HubSpot closed-won, Q3ArtifactExample from sample data
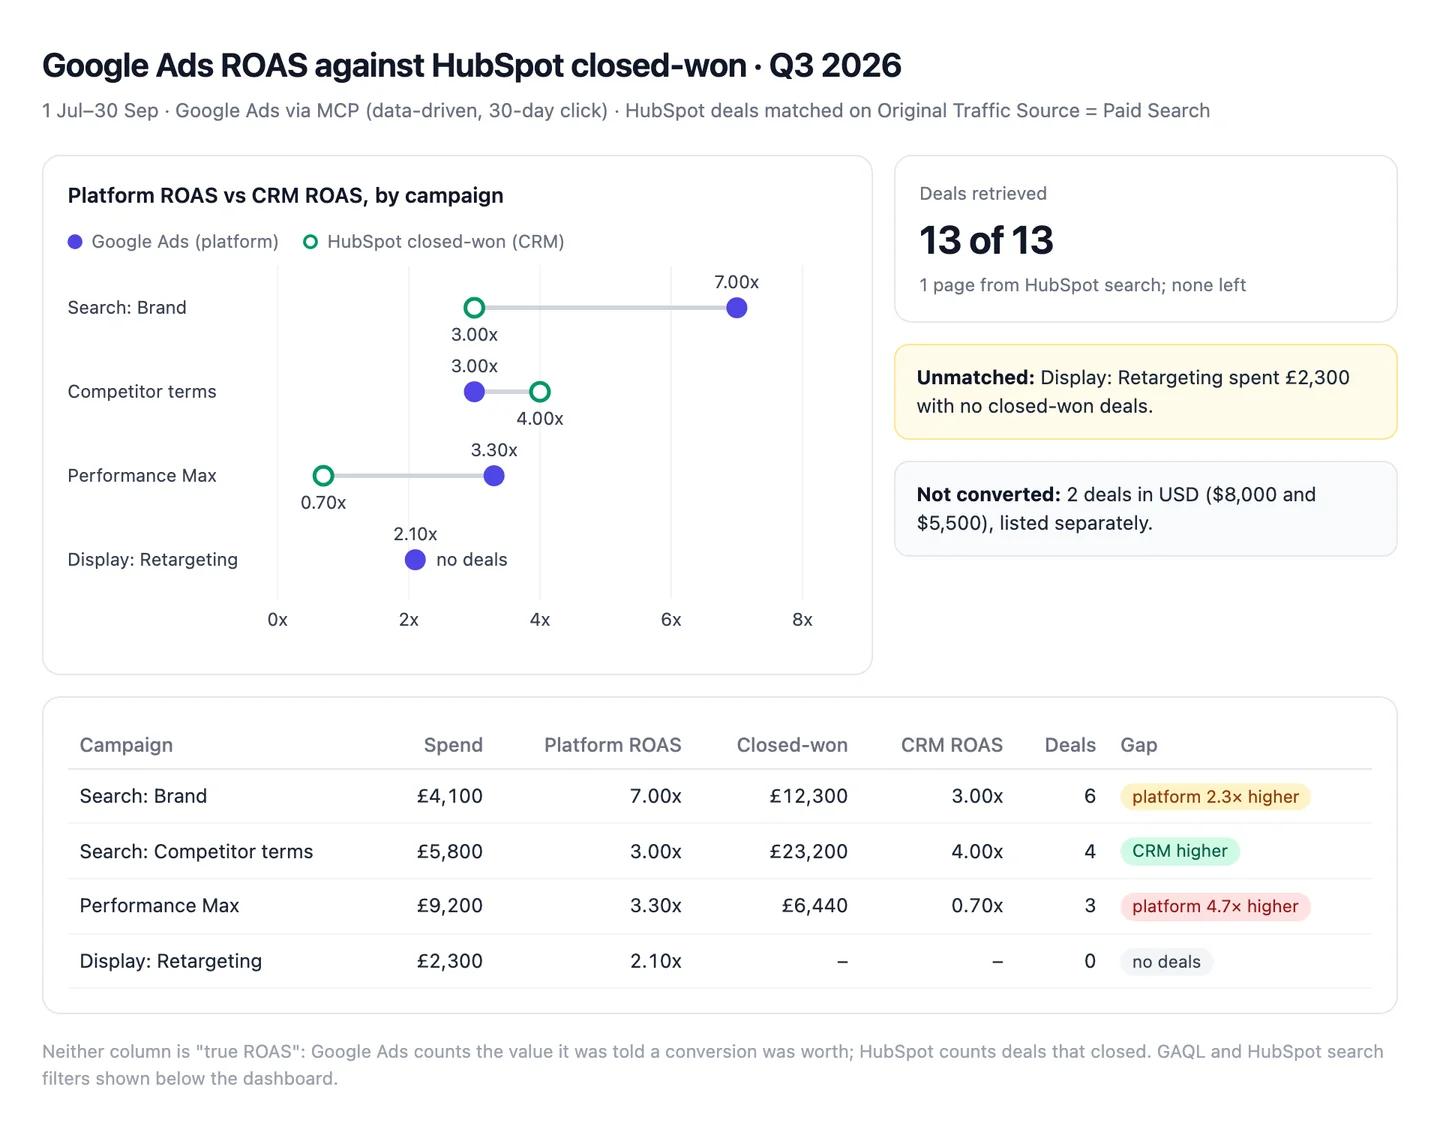
The numbers in this example
| Campaign | Spend | Platform ROAS | Closed-won | CRM ROAS | Deals |
|---|---|---|---|---|---|
| Search: Brand | £4,100 | 7.00x | £12,300 | 3.00x | 6 |
| Search: Competitor terms | £5,800 | 3.00x | £23,200 | 4.00x | 4 |
| Performance Max | £9,200 | 3.30x | £6,440 | 0.70x | 3 |
| Display: Retargeting | £2,300 | 2.10x | none | none | 0 |
- Largest gaps: Performance Max claims 3.30x and closed 0.70x. Brand claims 7.00x and closed 3.00x. Competitor terms is the one campaign that closed more than Google Ads reports.
- Not converted: 2 deals in USD ($8,000 and $5,500), listed separately.
- Unmatched: 1 campaign with spend and no deals (Display: Retargeting).
 AI output auditRuns on every answer
Performance Max closed 0.70x Assumption against the 3.30x Google Ads reports, the biggest gap of any campaign. Brand's platform ROAS is inflated by people who'd have bought anyway Model knowledge. All 13 matching deals were retrieved Citation from HubSpot.
Assumption
Performance Max closed 0.70x
Deals were matched to campaigns by the contact's first traffic source. A deal that came through Performance Max but first arrived from a Brand search counts as Brand, so Performance Max may look worse than it is.
Model knowledge
Brand ROAS is inflated by people who'd have bought anyway
A common belief, not something in your data. Fine as a question to test; not a finding to put in the board pack.
Citation
13 of 13 deals retrieved
HubSpot returned every matching deal, so none are missing from the totals.
What's a good ROAS?
A good ROAS is one above your break-even. Below it, each first sale loses money and you're relying on customers coming back. Break-even depends on a single number, your gross margin:
Formula: Break-even ROAS = 1 ÷ gross margin
| Gross margin | Break-even ROAS |
|---|---|
| 20% | 5.0 |
| 25% | 4.0 |
| 40% | 2.5 |
| 50% | 2.0 |
| 70% | 1.4 |
That's why a ROAS of 3 is a good month for a software company and a loss for a retailer on 25% margins. Tables of "average ROAS by industry" mix businesses with different margins, attribution settings and definitions of revenue, so we don't publish one. Your own break-even is a better benchmark than anyone else's average.
Two things to watch when you compare:
- Use the same definition of value on both sides. If your margin is calculated on net revenue, compare it with net ROAS (2.8 in the example above), not the platform's 4.5.
- Repeat purchases change the maths. For subscriptions, or customers who reliably buy again, a first-order ROAS below break-even can be fine. Judge it against Customer Lifetime Value from Ads and how long the customer takes to pay back instead.
Why is my ROAS falling?
Check measurement before you check performance. It's the cheaper thing to rule out, and the fix is quicker.
Tracking changed. A broken tag, a new consent banner, a different attribution setting. The giveaway is conversions falling in the ad platform but not in your order system.
The same clicks cost more. If Cost Per Click (CPC) is rising while Conversion Rate holds steady, you're in a pricier auction. Cost Per Acquisition (CPA) will be climbing too.
Clicks stopped converting. If conversion rate is falling while CPC is flat, look at the landing page, the offer, stock levels and price before you touch the ads.
The audience is tired. Frequency rising and click-through rate falling usually means people have seen the ad too often.
Orders got smaller. The same number of conversions with less value behind them points to discounting or a shift towards cheaper products.
Work through them in that order. The first two are often fixed within a day; the last three take longer.
How to improve ROAS
Most ROAS advice comes down to "improve your targeting and creative". True, but not much use on a Monday morning. The levers that move the number fastest are more specific.
Cut what's below break-even, segment by segment. Campaign-level ROAS hides losing keywords, products and audiences inside a healthy average. Break it down and pause the segments below your break-even line.
Set targets from your margin, not last month. If you use value-based bidding, such as Target ROAS in Google Ads, set the target from your break-even. Last month's average is a description, not a goal.
Send better values. If you can send margin rather than revenue as the conversion value, the platform optimises for profit instead of sales.
Fix the page, not just the ad. Conversion rate is half of ROAS, and it's often cheaper to raise on the landing page than in the ad account.
Raise the order value. Bundles and free-delivery thresholds lift value per conversion without touching the media spend. Cost Per Acquisition (CPA) stays the same while ROAS goes up.