Ever feel overwhelmed by the sheer volume of dashboards you have to check daily? You're not alone.
Data professionals and business leaders commonly grapple with information overload, juggling multiple dashboards just to figure out what truly drives their business.
One answer: A metric tree. It's just, building one can be much easier said than done.
In our recent live build session webinar, Ollie Hughes, CEO at Count, and Mitra Abrahams, Head of Customer Success, tackled this challenge head on. Mitra demonstrated step-by-step how you can create a metric tree from scratch to transform chaos into clarity.
Here, we give an overview summary from the webinar of the key points you need to know before building your first tree. Make sure to watch the webinar recording to get the full details.
🖥️FULL WEBINAR:Live Build Session: How to Create a Clarity Defining Metric Tree From Scratch
🗳️ Poll Results: What you said about dashboards
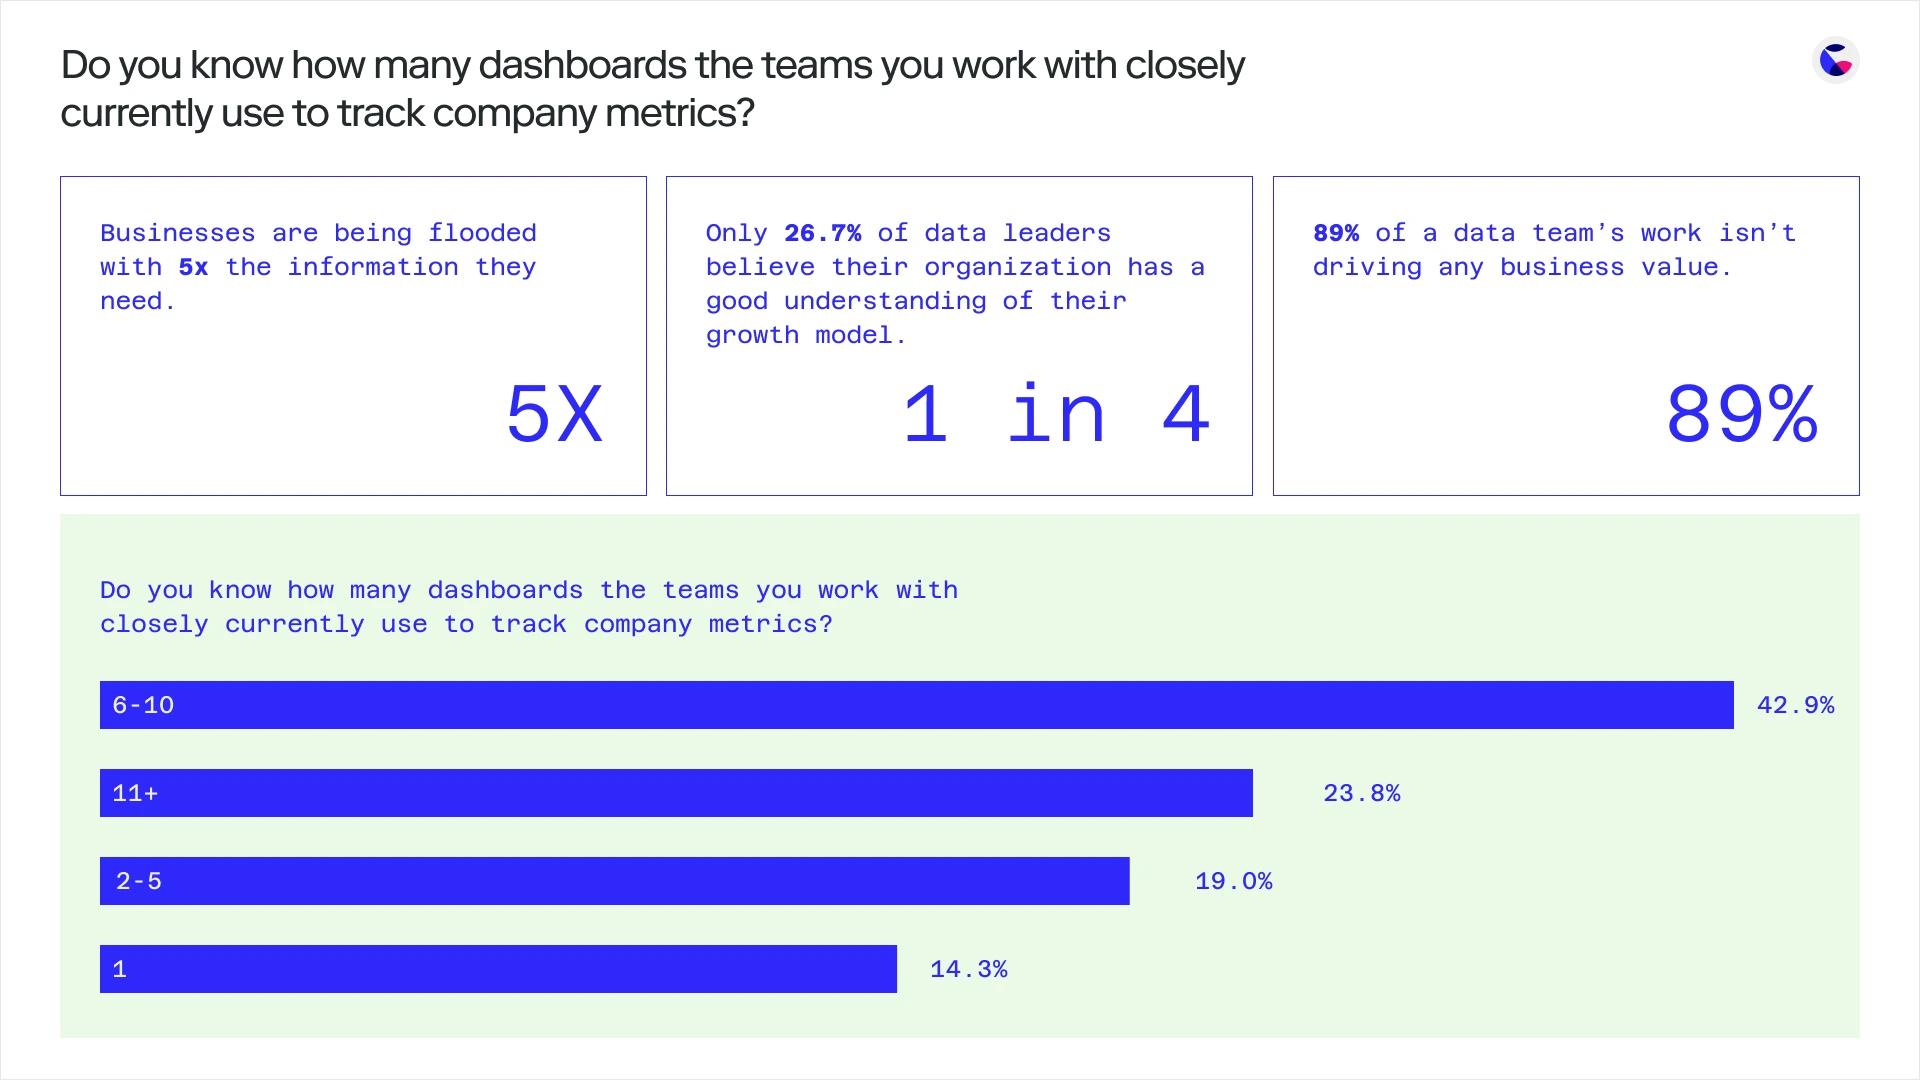
Before the session, we asked everyone who registered to fill out a survey about their company's current use of data and dashboards. The results were pretty eye-opening.
- Businesses are getting flooded with 5x more information than needed
- Only 1 in 4 believe their org has a good understanding of its growth model
- Data teams estimated that a whopping 89% of their work doesn't drive any value
- Over 66% of orgs rely on more than five dashboards, with almost 1/4 using 11 or more
7 key themes from our metric tree webinar
The webinar itself goes into much (much) more detail. But here are the cliff notes and overarching key points you need to remember to start building out your first metric tree:
1. Why metric trees?
To start the session, Ollie shared a startling insight:
Over half of organizations juggle six or more dashboards daily, with a quarter navigating more than eleven dashboards just to understand what's happening in their business.
The result? Confusion, inefficiency, and an unclear understanding of growth drivers.
Metric trees solve this by condensing multiple dashboards into a single, clear view that pinpoints exactly what matters most.
💡Key takeaway:A well-designed metric tree cuts through the noise, aligning your data team around solving the most impactful business problems.
2. Use these six stages to create your metric tree
Creating your metric tree can be logical—and even enjoyable—if you follow clear, manageable stages. Mitra outlined these essential steps:
- Identify your North Star metric and outline your structure.
- Ensure your data is reliable and ready for use.
- Follow your validated plan to construct your metric tree clearly and confidently.
- Integrate your metric tree into everyday business practices.
- Regularly assess whether the metric tree is delivering the desired business outcomes.
- Continuously refine and evolve your metric tree as your business grows and changes.
🔥Lesson:Treat your metric tree as a living document, adapting it consistently to stay aligned with your evolving business goals.
3. Deconstruct your North Star metric
Mitra emphasized starting simple. The first step: define your North Star metric—like revenue—and then break it down into its core components (new business, expansion, churn).
The beauty of this method? It turns overwhelming data into actionable insights, guiding your team's focus toward metrics you can directly influence.
🚀Pro tip:Collaborate early and often. Engage cross-functional teams and secure senior sponsorship for broader organizational buy-in.
4. Validating your data
Before diving deep into building your metric tree, ensure your data is reliable. Mitra recommends verifying key metrics by comparing your preliminary calculations against your trusted sources.
🔥Lesson:Document everything clearly—decisions, caveats, logic—so everyone understands the reasoning behind each metric.
5. Building with confidence
With your data validated, building your metric tree becomes straightforward. Mitra walked attendees through building simple, visually engaging metric cards connected into a clear, intuitive tree structure.
🙌The result:A polished, easy-to-understand visual metric tree, immediately usable and impactful.
6. Using your metric tree
A metric tree isn’t just another report—it’s a tool for driving action.
Mitra and Ollie demonstrated how metric trees enable teams to quickly identify business trends and issues, explore underlying data in real-time, and collaborate effectively on solutions.
💡Key takeaway:Metric trees are living documents. Set regular alerts and reviews to ensure your metric tree evolves with your business.
7. Metric maps aren’t just for revenue
While revenue metric trees are common, Ollie highlighted that metric maps can clarify numerous aspects of your business. Here are several inspiring examples:
- Clearly visualize the ins and outs of money flowing through your business, pinpointing key financial phases and buckets.
- Contextualize dozens of metrics to track user journey stages from initial interest to becoming an advocate, making complex processes clearer.
- Inspired by Duolingo's work, a metric map can illustrate detailed retention stages and their interactions clearly.
- Map user journeys through onboarding to highlight drop-off points and opportunities for improvement.
- Clarify key operational metrics and how they interact to drive efficiency and improvement.
💡Key takeaway:Metric mapping is a versatile tool, beneficial across various business functions—not just revenue.
Start your journey to clearer insights today
Creating a clarity-defining metric tree doesn’t have to be daunting. By breaking down the process into clear steps—from planning and data validation to building and embedding it in your organization—you can transform how your business uses data to drive growth and clarity.
Want to dive deeper?Watch the full webinarto see exactly how you can build and leverage a metric tree for your organization.