Break down silos and speed up problem solving
Stop the cycle of adhoc analysis and empower your teams to access the data they need to deliver improvement


“Count has been a fundamental building block for our data org to move towards a world of advanced self serve and collaboration. It's allowed us to deliver value more quickly and ensure we're optimising the time we spend building great analysis and great visualisations.”
Drag and drop answers
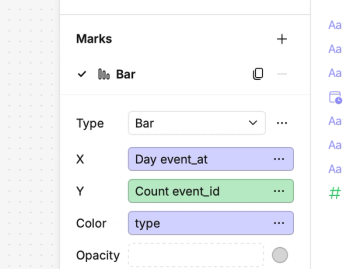
Count Metrics lets data teams fix aggregations and definitions, so the entire company can work with meaningful metrics, in a responsive, drag-and-drop way. Create tables and visualisations to explore data without the risk of misrepresenting it.
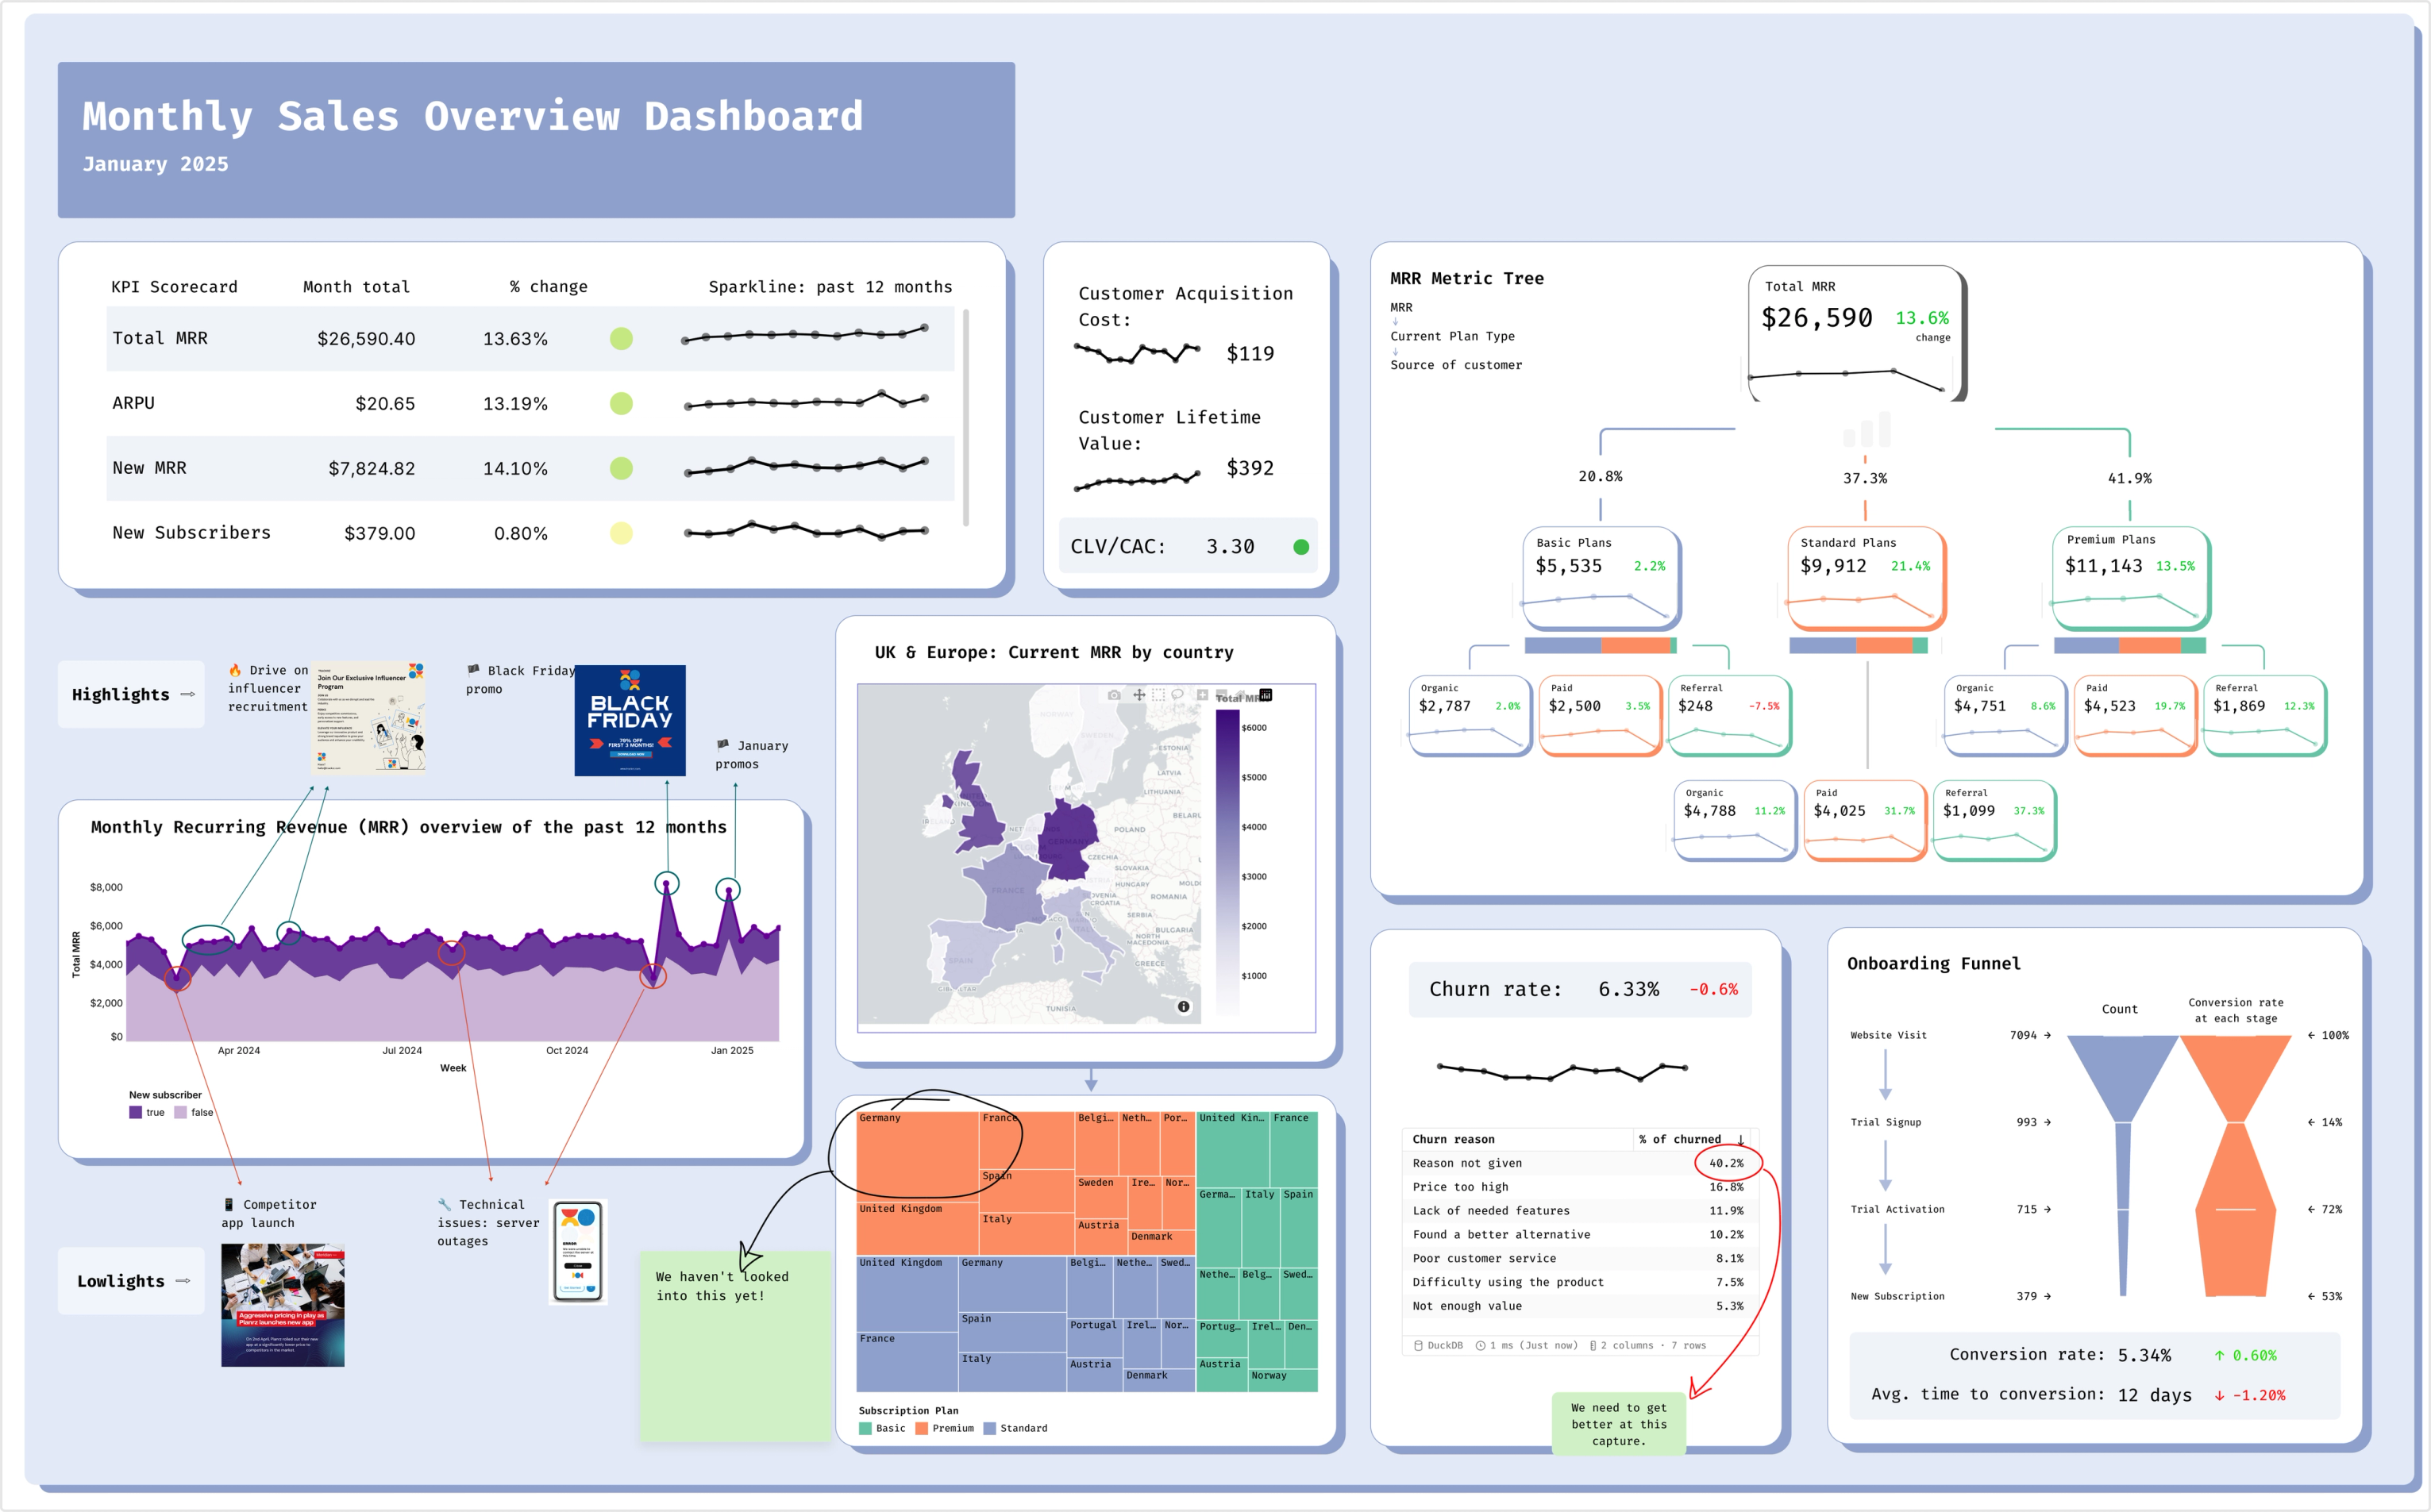
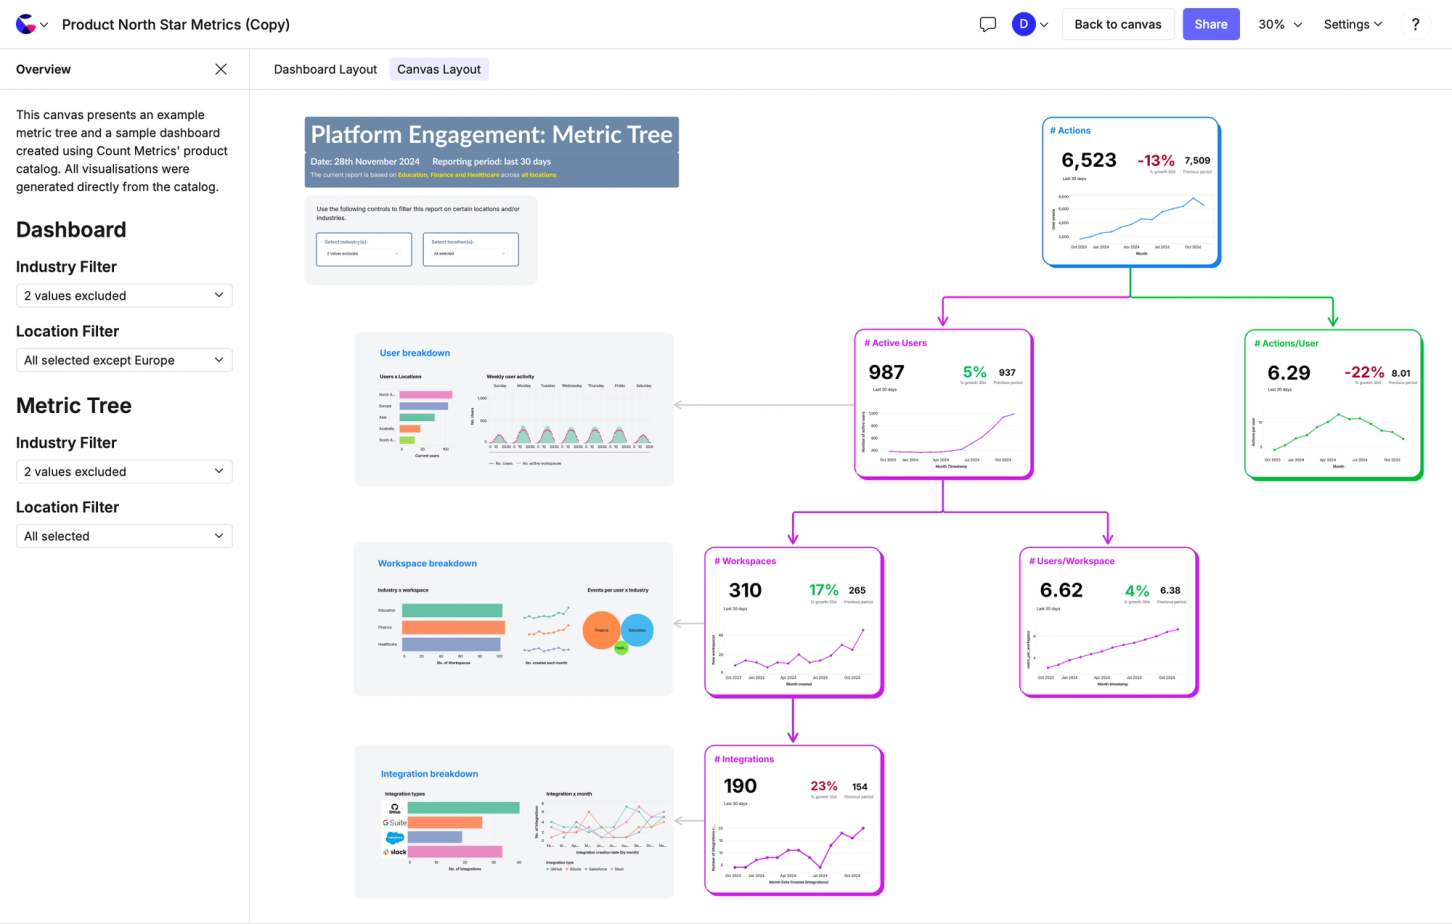
Reports that are the final word and the first
Reports aren't just PDFs and decks in Count (but yeah, we do those too), they are powerful starting points for teams to jump off into their own analysis. Dive into individual visualisations and tables to apply your own filters or move fledgling analysis into its own canvas for sharing onwards.
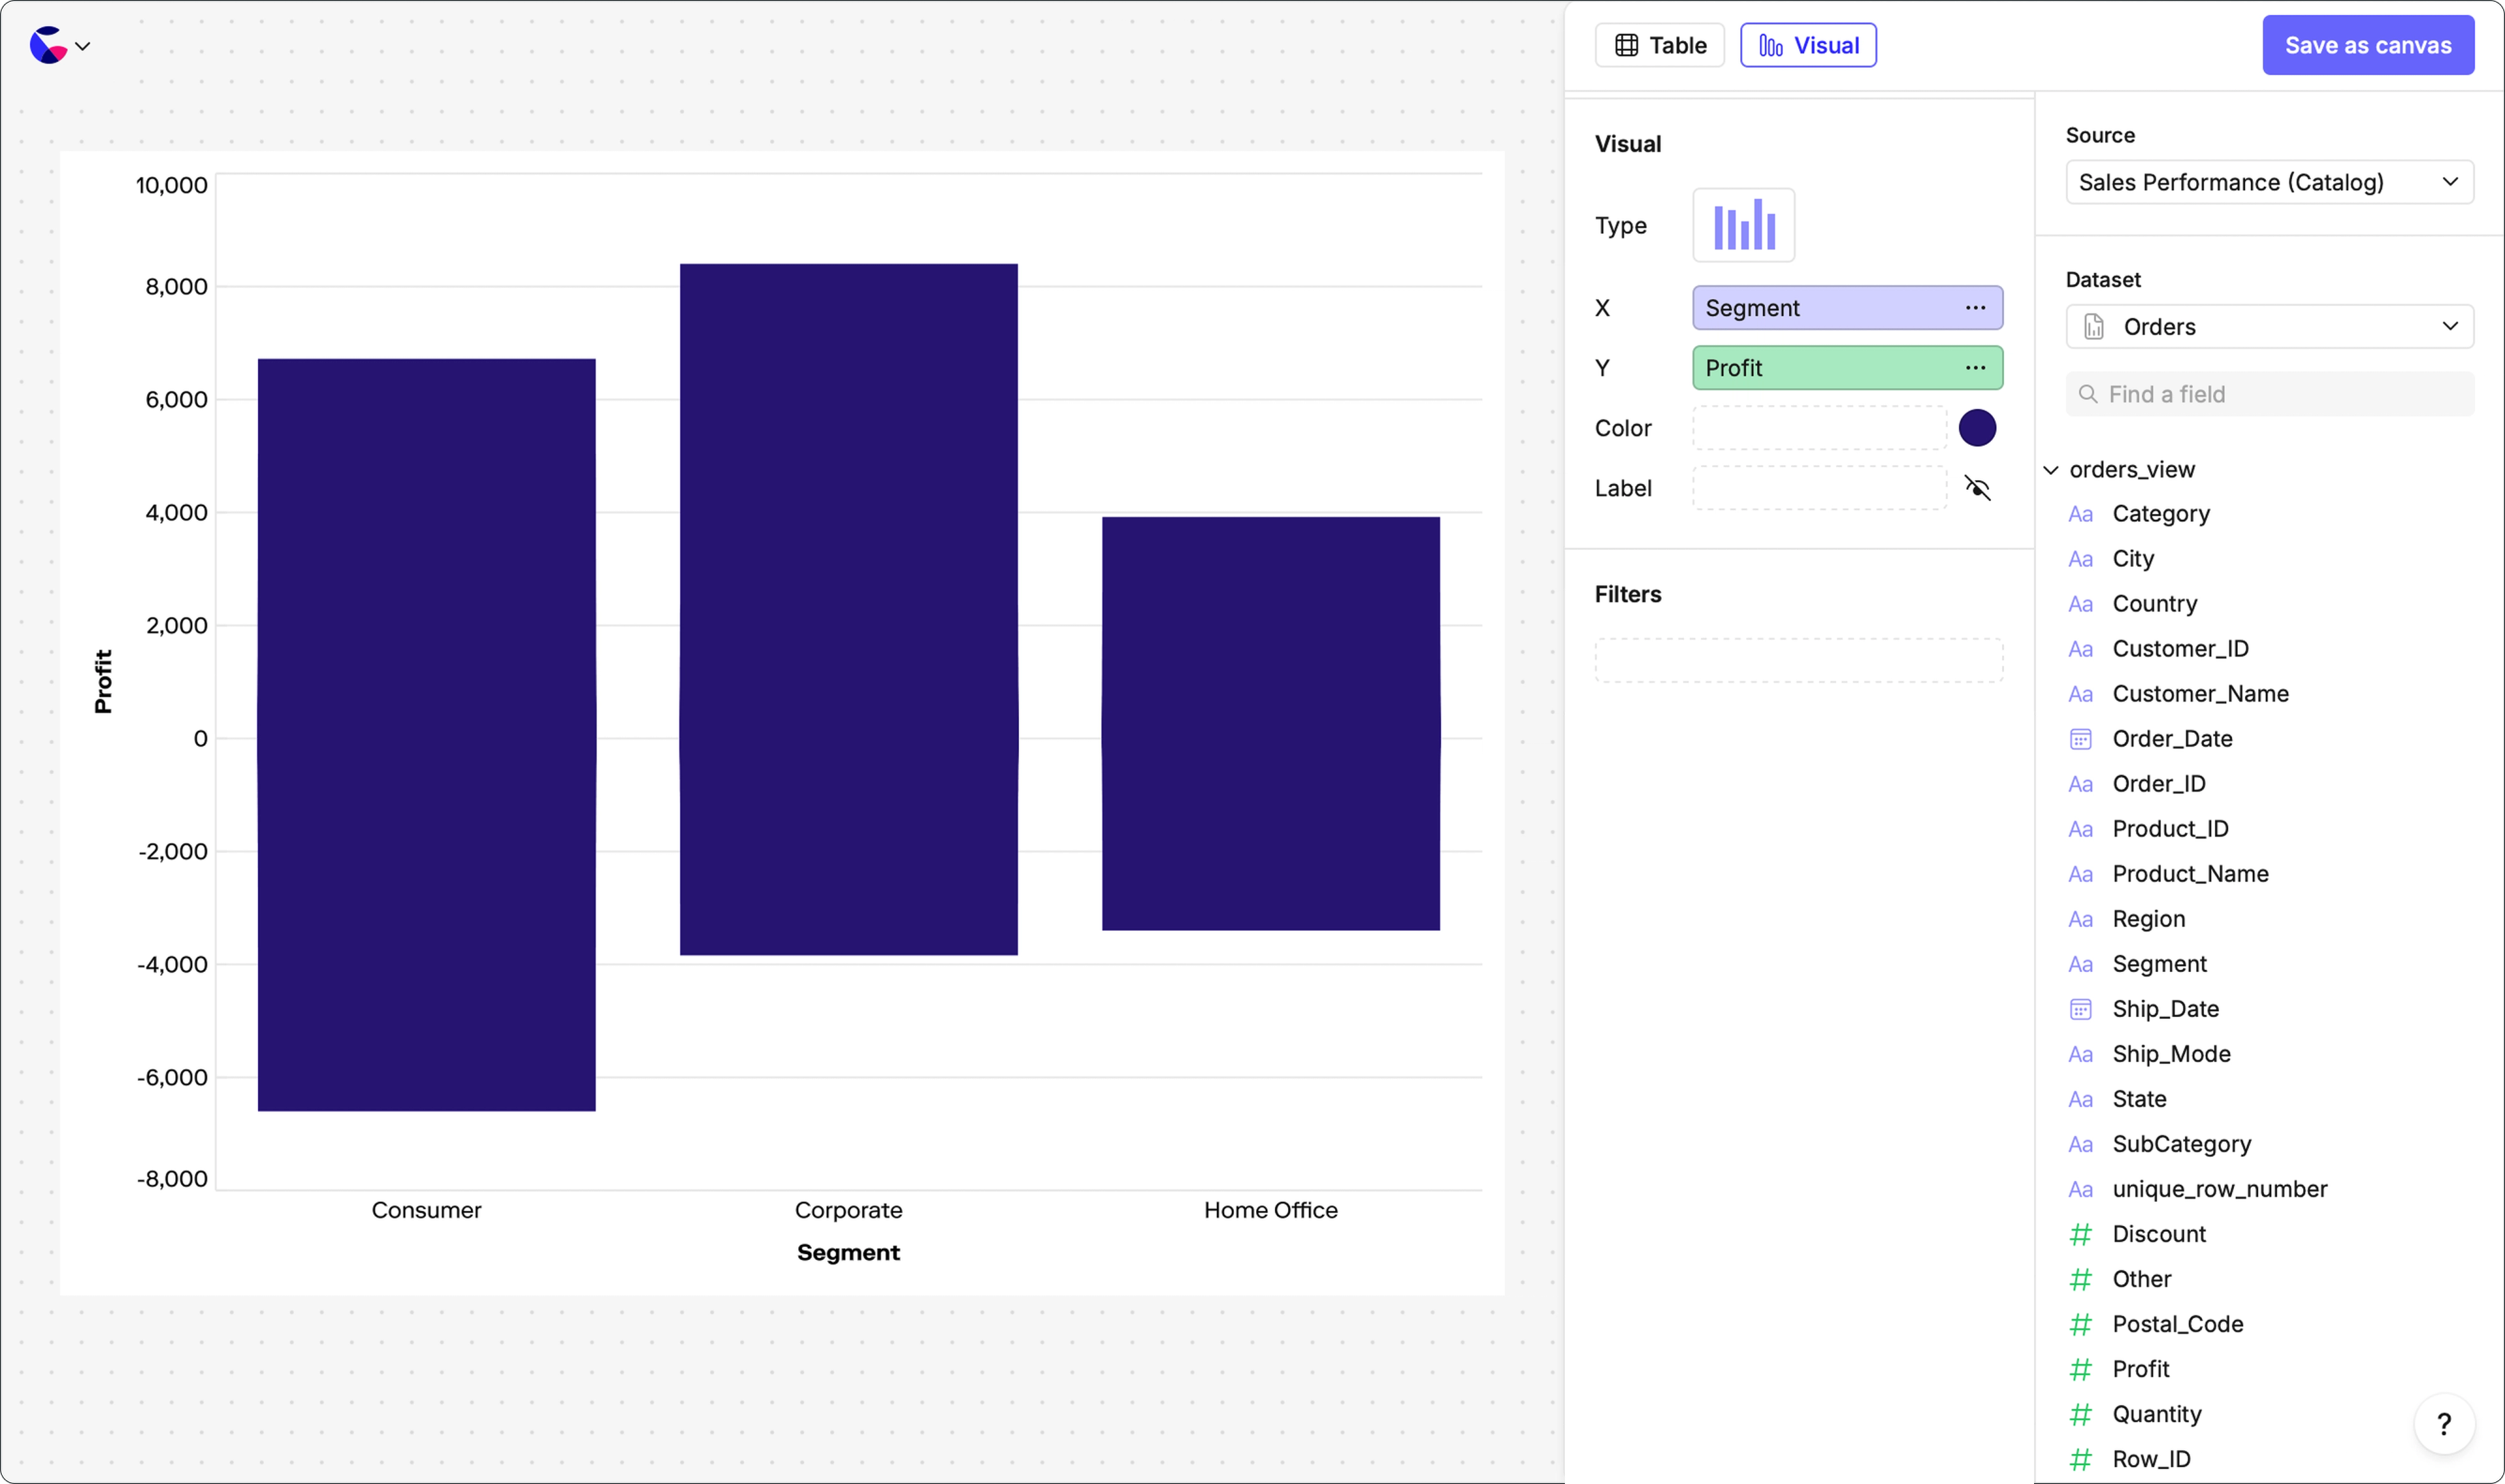
You don't have to be an analyst to Explore
Make self-serve a reality for your entire organization, without drowning in spaghetti SQL. Give Explorers a stripped-back, standalone environment to explore your Count Metrics catalogs and answer their own questions.
Related Resources

Frequently Asked Questions
Count offers flexible caching at both workspace and canvas levels. You can set cache duration (how long results are stored), configure scheduled refreshes using cron expressions, and choose between always-fresh, time-based, or manual refresh modes to balance data freshness against database load.
Yes, through Explorer roles and low-code/visual cells. Explorers can use drag-and-drop functionality on pre-built datasets from Count Metrics (the semantic layer) to create their own analyses without writing SQL, while analysts maintain governance through the semantic layer.
Count provides role-based permissions (Owner, Admin, Analyst, Explorer, Member, Viewer, Guest), project-level access controls, table-level restrictions, and Count Metrics (semantic layer) to define centralized, governed metrics. Admins control database connections and can disable features like caching or restrict sharing.
Yes, Count Metrics allows you to define metrics once in catalogs with version control, then use them consistently everywhere. Focus on common metrics, frequently reused logic, and business-critical KPIs while avoiding ad-hoc or one-off definitions.
Yes, through project-based permissions, role assignments, and table access restrictions. Admins can control who accesses specific database connections and projects, with granular control from workspace to canvas level.