The Gallery
From ad hoc analyses to KPI reports and everything in between. Discover the different ways a canvas can bring your data to life.
Most popular
ABX Funnel
See true account progression, not scattered leads. Count’s ABX funnel scores engagement by stage to align marketing and sales and trigger smarter, targeted campaigns.
Marketing Attribution Canvas
Build flexible, multi-touch attribution models without data teams to see what truly drives results and make faster, more confident budget and strategy decisions.
Intruder's Company OKR Canvas
Align every team to your North Star with a live OKR canvas that connects real-time data, initiatives, and KPIs into one clear, measurable view.
Simple Onboarding Funnel
Visual onboarding funnels with live data, screenshots, and drop-off insights so product teams instantly see what’s breaking activation and where to fix for more revenue.
Use case
ABX Funnel
See true account progression, not scattered leads. Count’s ABX funnel scores engagement by stage to align marketing and sales and trigger smarter, targeted campaigns.
Marketing Attribution Canvas
Build flexible, multi-touch attribution models without data teams to see what truly drives results and make faster, more confident budget and strategy decisions.
Intruder's Company OKR Canvas
Align every team to your North Star with a live OKR canvas that connects real-time data, initiatives, and KPIs into one clear, measurable view.
Simple Onboarding Funnel
Visual onboarding funnels with live data, screenshots, and drop-off insights so product teams instantly see what’s breaking activation and where to fix for more revenue.
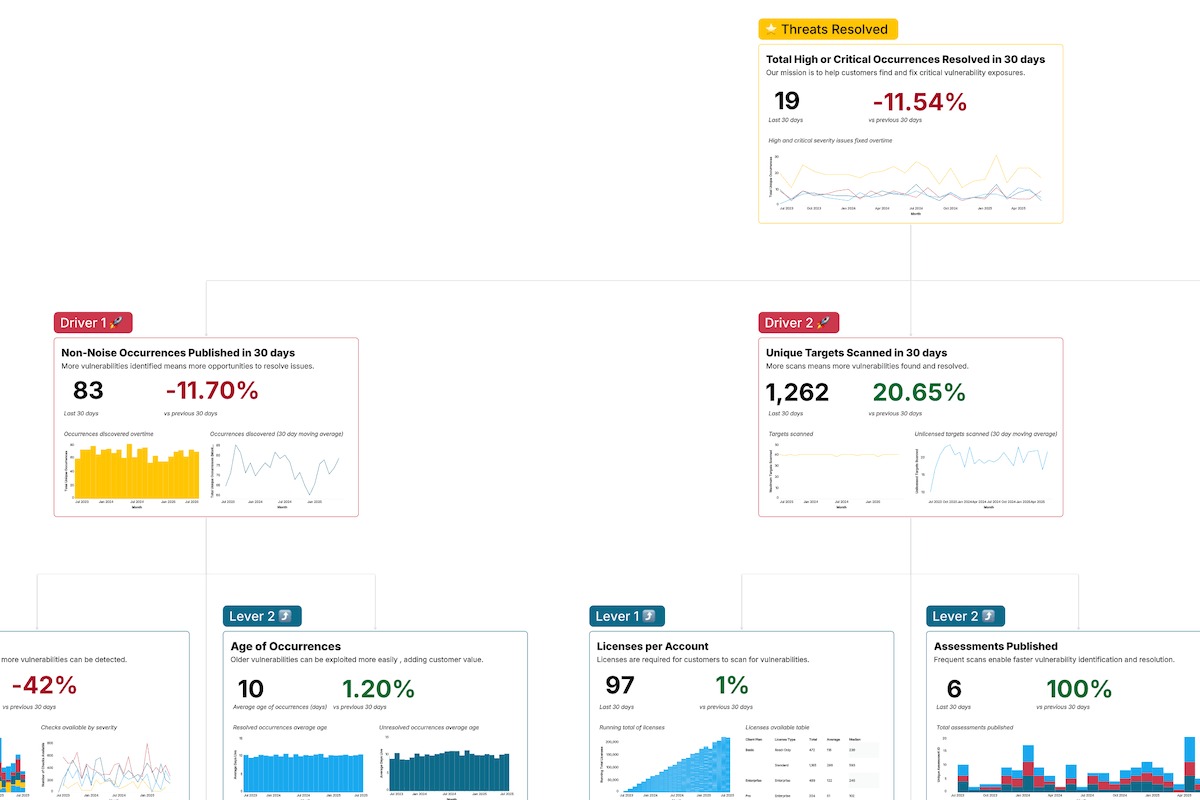
Intruder's Product Metrics Map
See how Intruder mapped product metrics to a North Star, aligning usage, customer value, and business growth in one clear, actionable view.
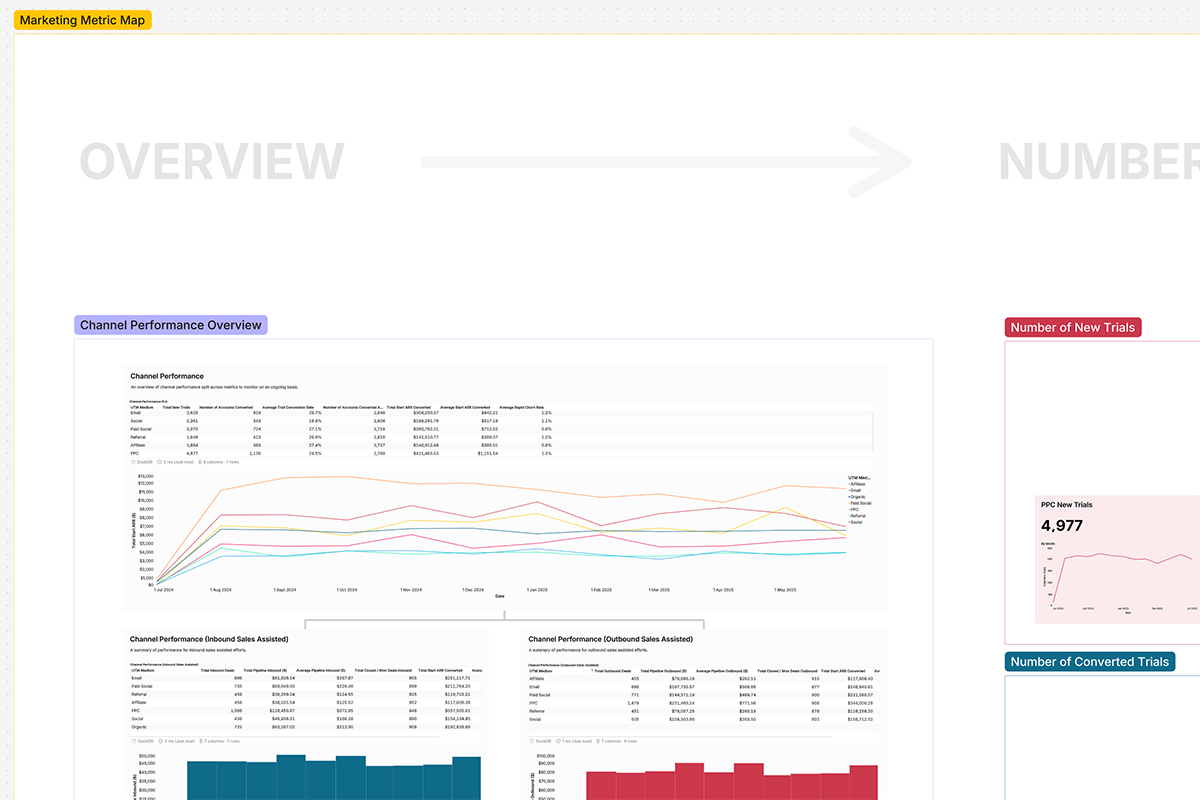
Intruder's Marketing Metrics Map
See how Intruder brought key marketing metrics into a single canvas to showcase the real go-to-market performance story.
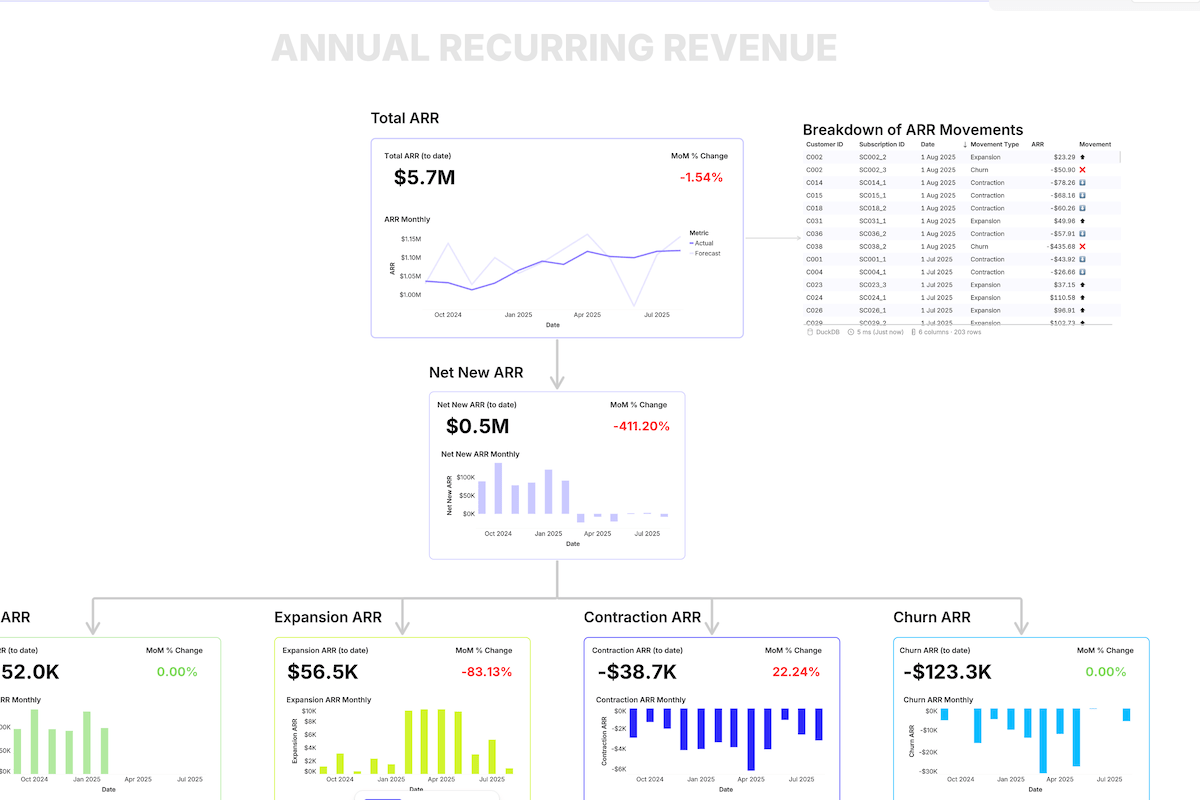
Finance Health Metric Map
Unified finance canvas to track ARR, deals, and payments in one place to monitor, prevent issues, and enable decisions.
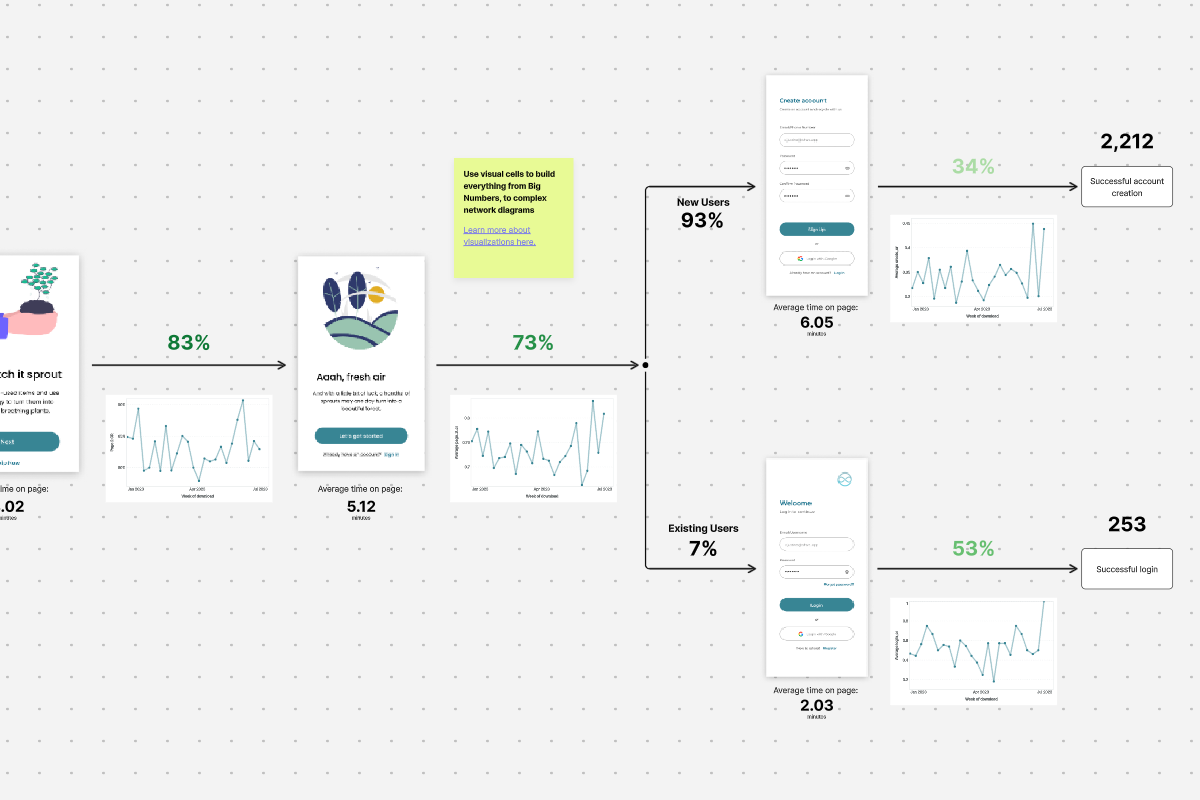
Onboarding Flow
Activity and conversion rates of a mobile app onboarding process, with screenshots and each possible user journey.
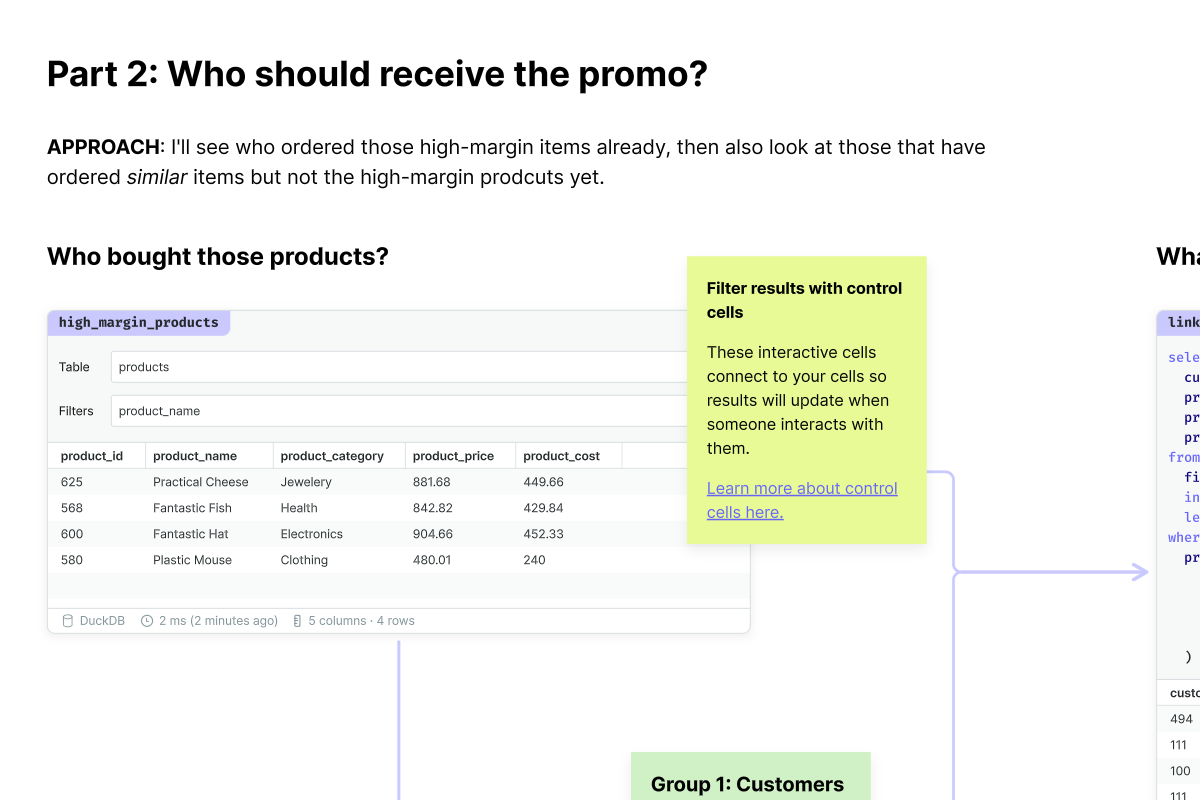
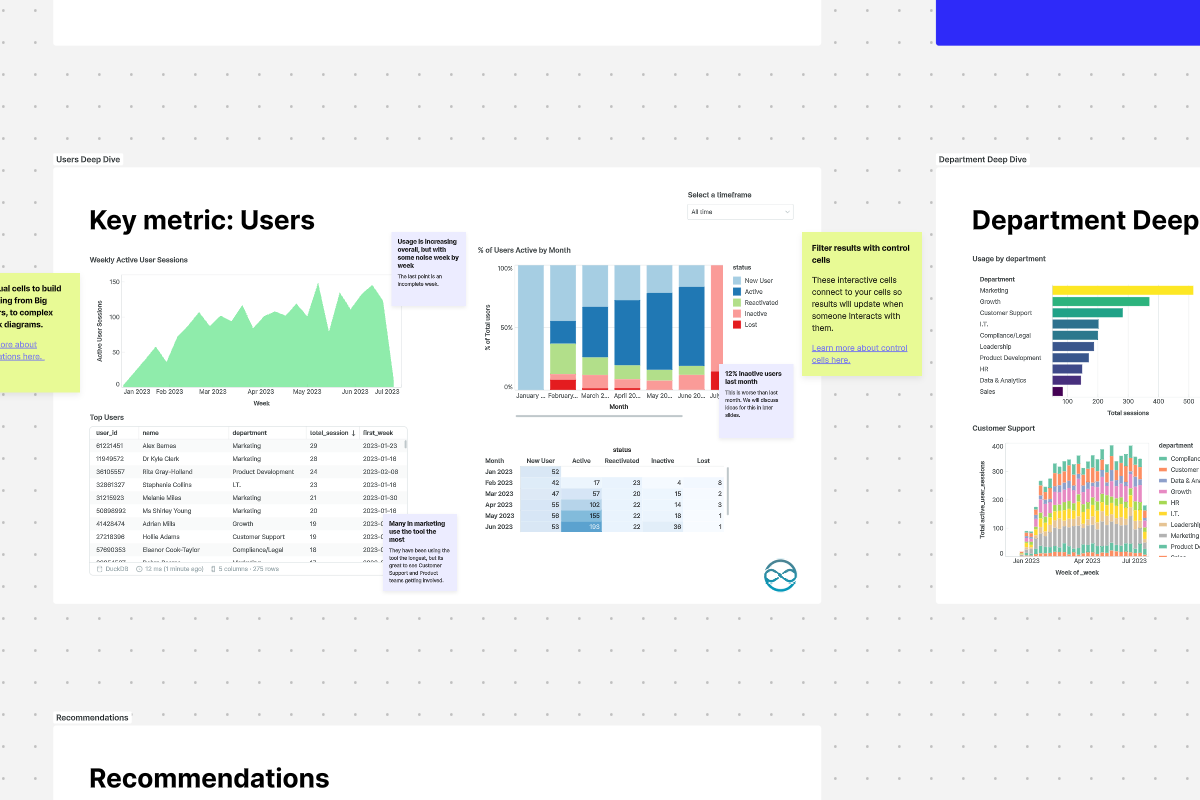
Data Exploration
Break down a data request into a logical structure and present back the answer alongside the methodology to provide perfect clarity.
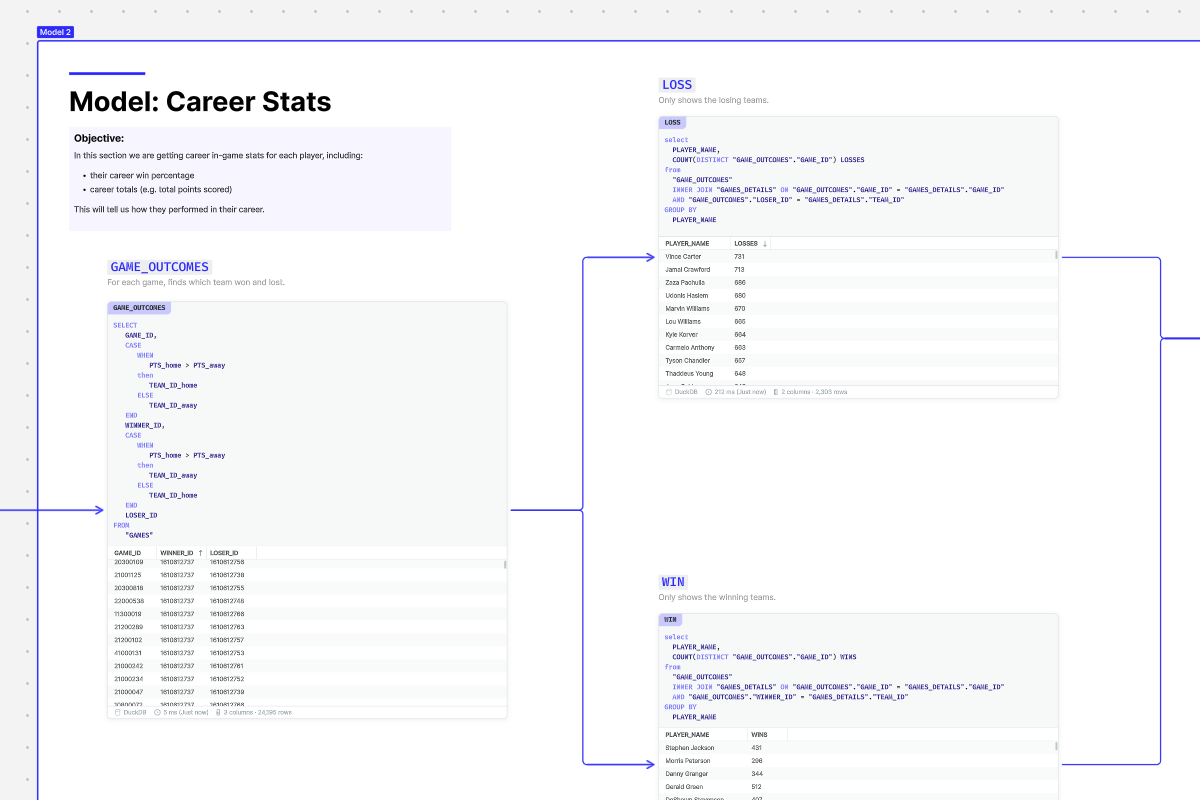
Data Transformation
Turning some messy tables of basketball data into a clean, robust data-model.
Metric Tree
Visualize and explore complex data relationships with Metric Tree, a clear, structured way to break down metrics and uncover insights.

The Ultimate Guide to dbt
Everything you could ever know about dbt, all in one canvas.
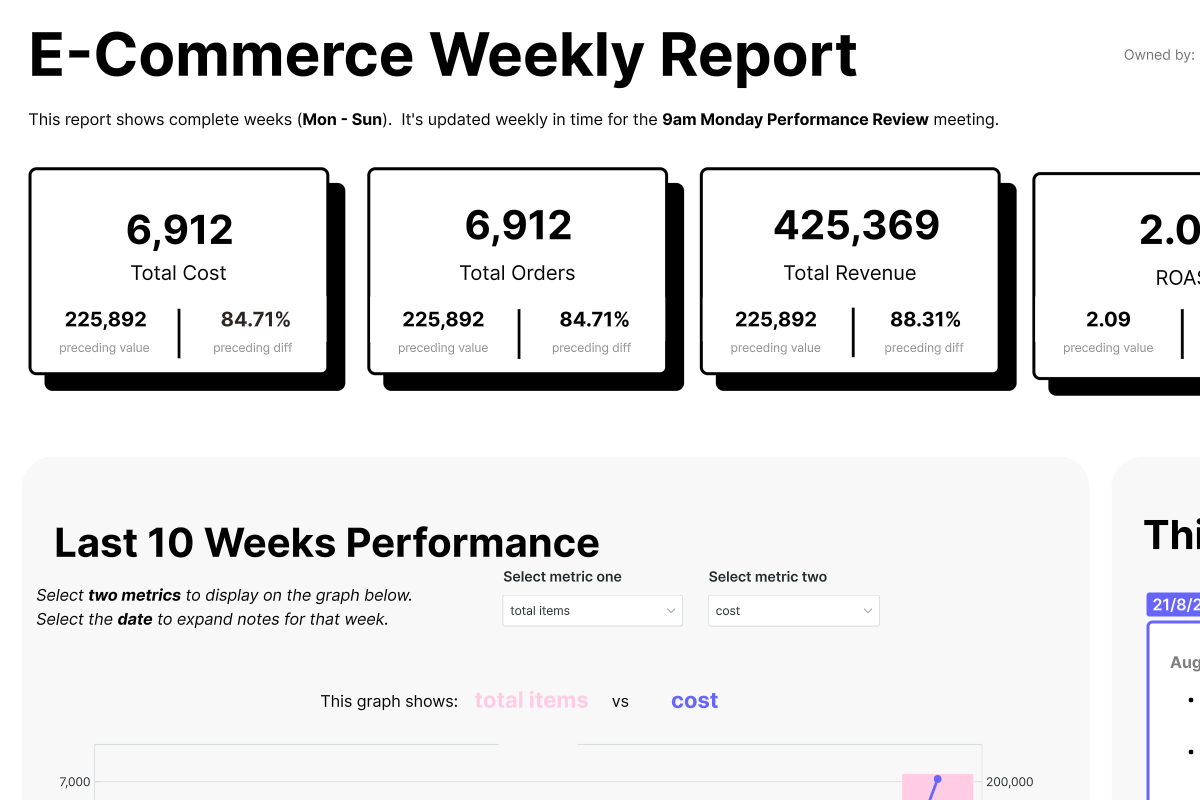
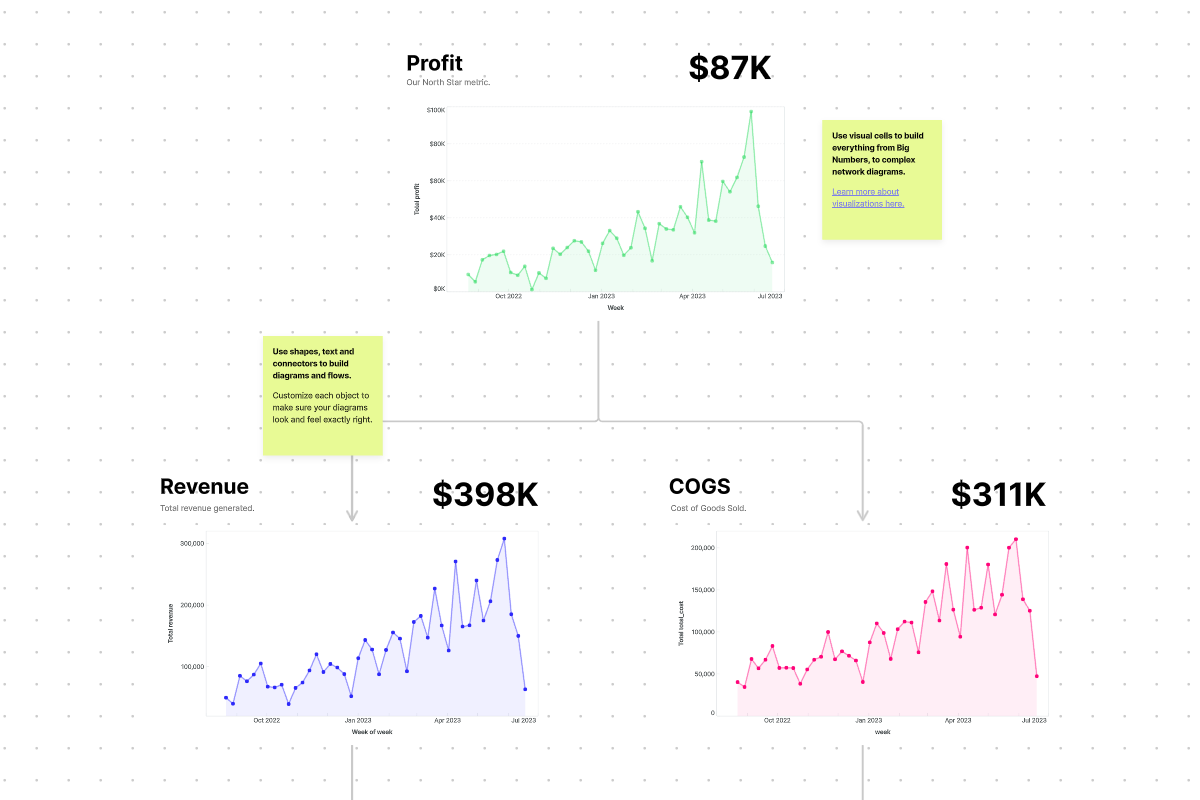
Ecommerce Overview Dashboard
Weekly performance overview of an ecommerce business, including commentary, metric definitions, and comments.
Client Quarterly Review
Build out a customer success presentation for client including live data of their product usage.
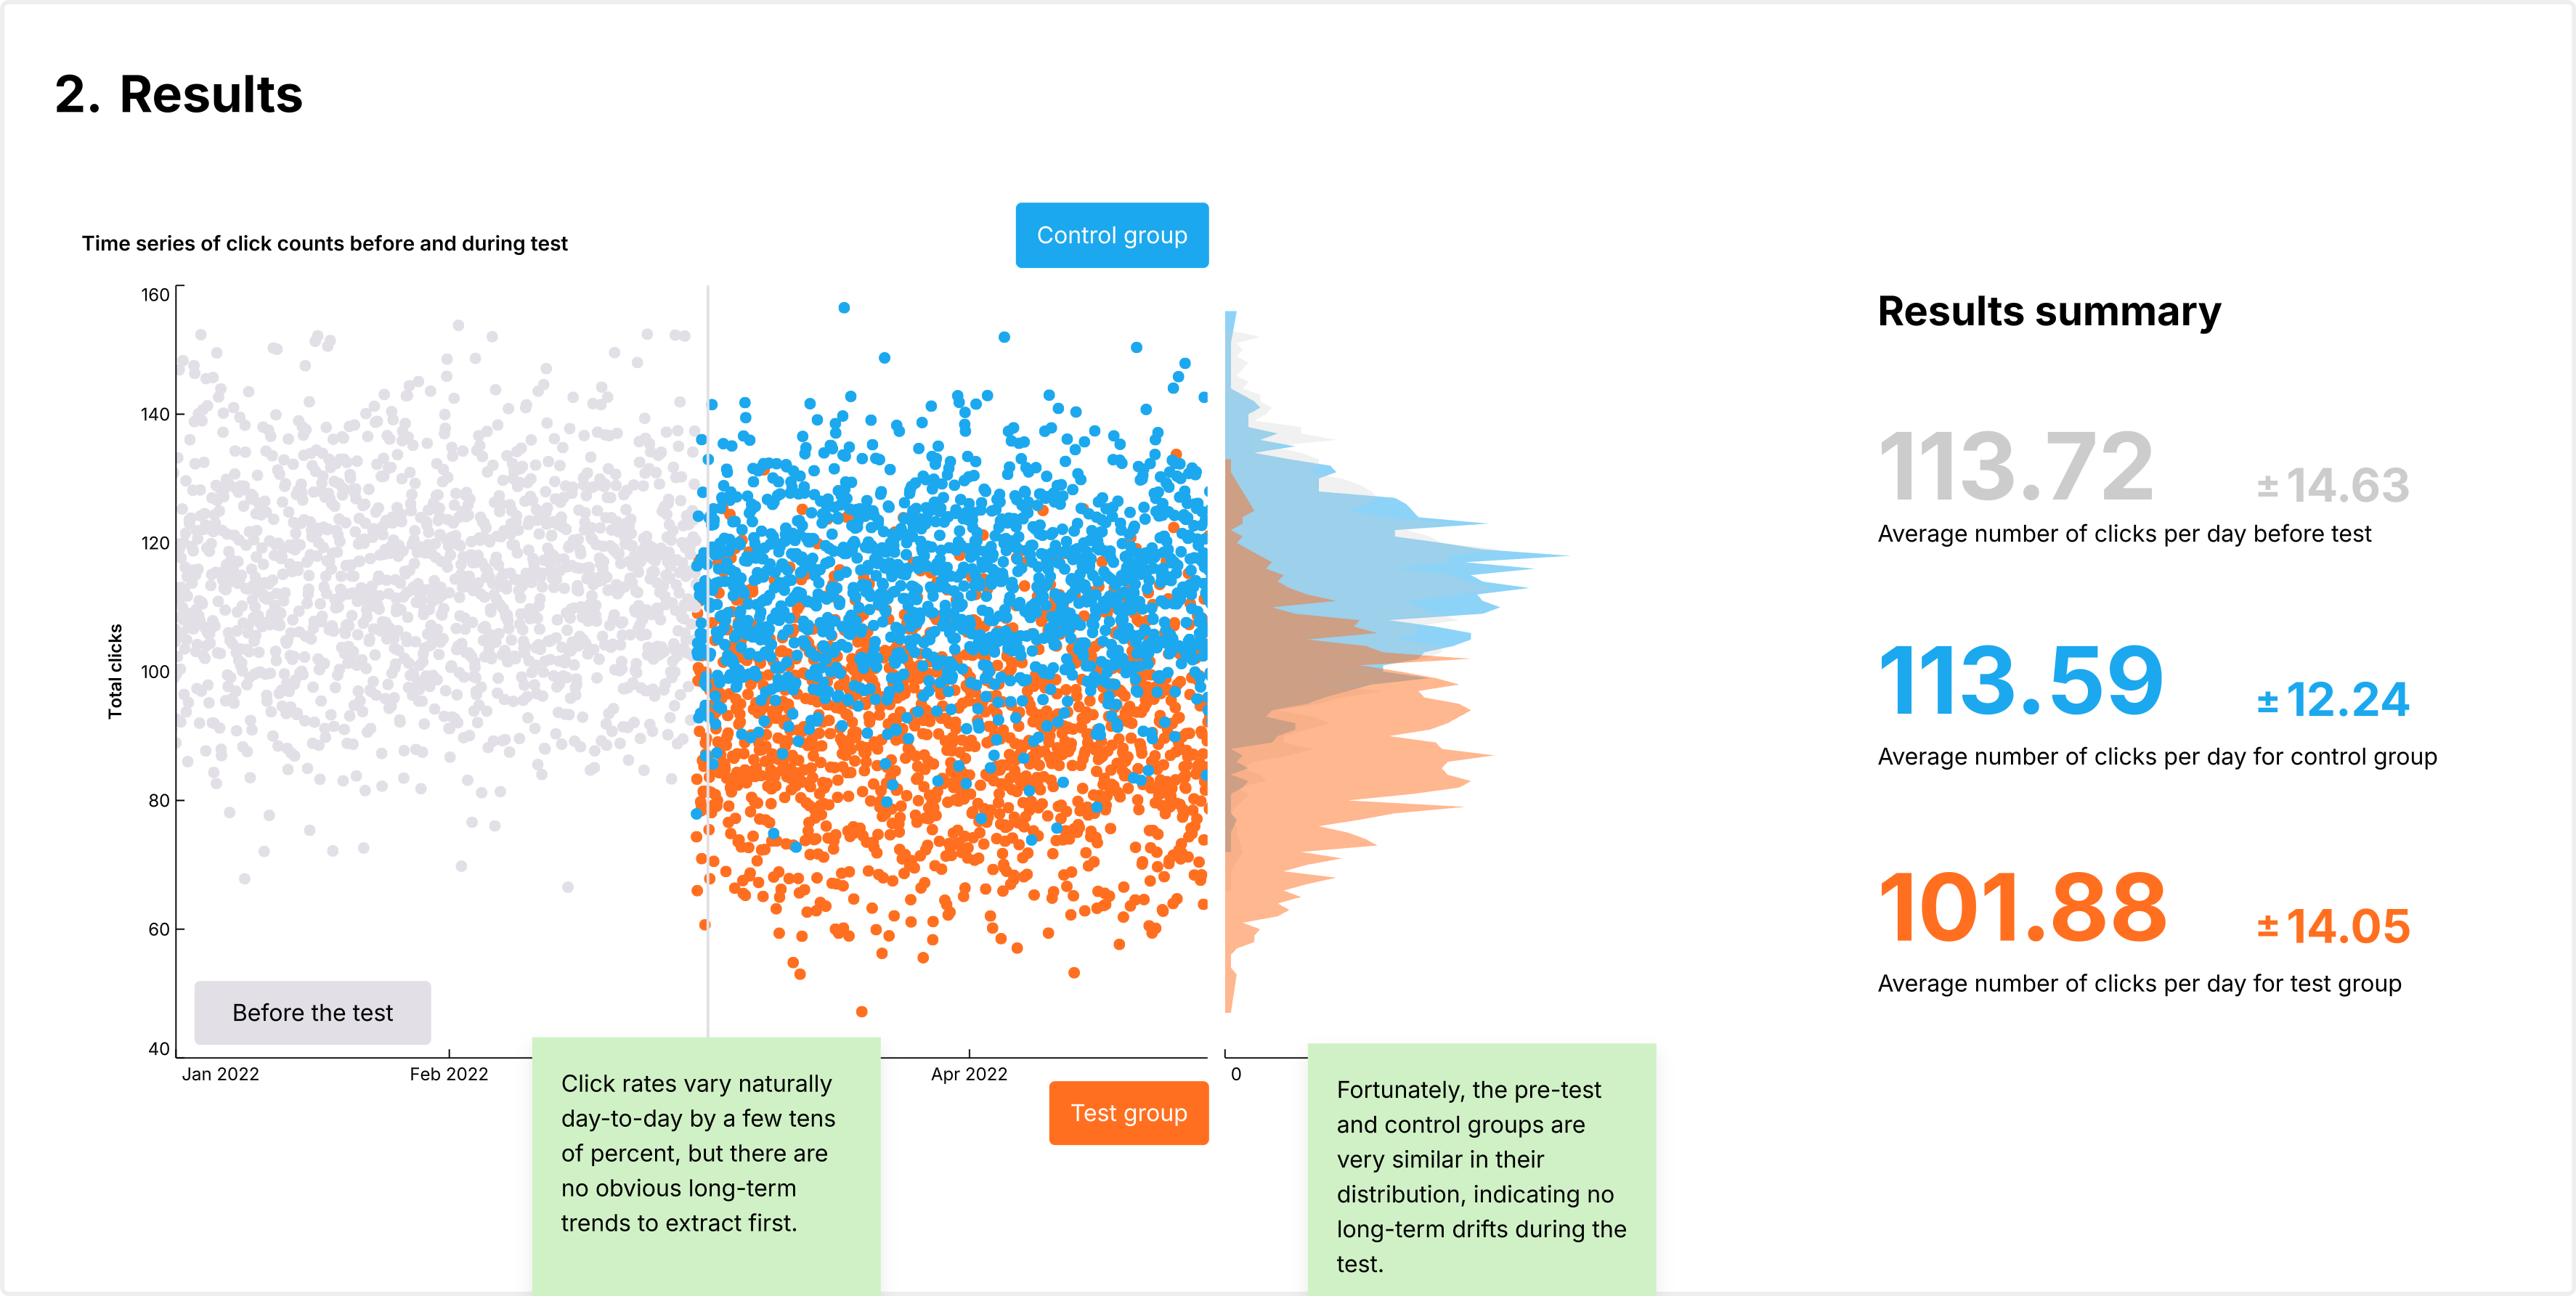
A/B Test
Run a full A/B test within one canvas, including the scope of the experiment, design and then the results, including statistical significance.
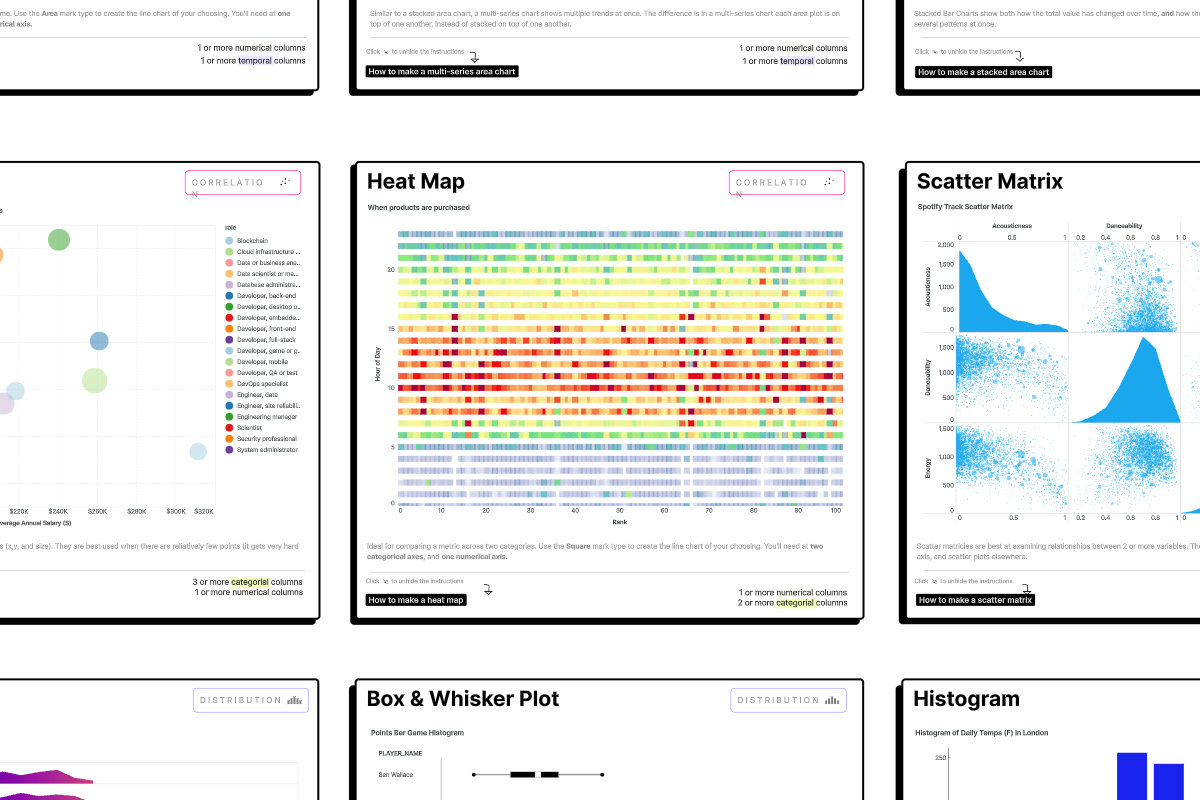
Every Visual Under the Sun
A selection of the visualizations that are possible with Count.
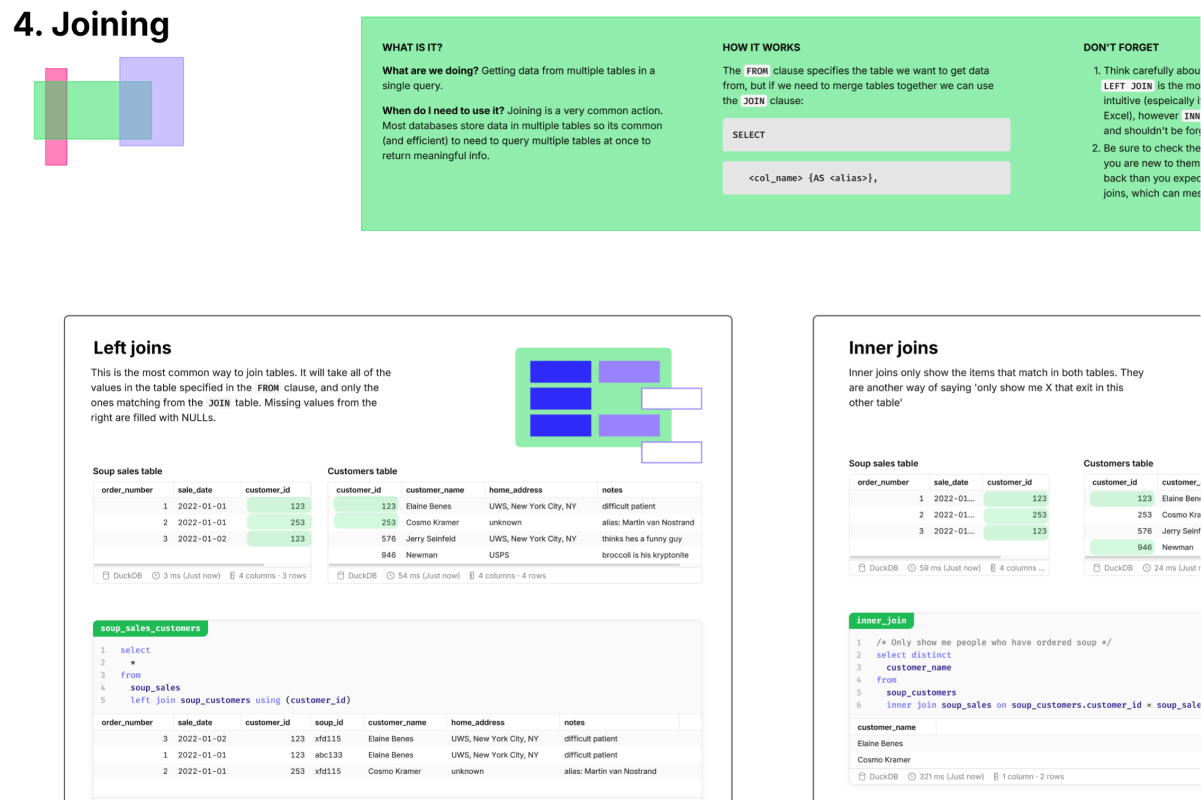
The Ultimate SQL Guide
Master SQL fast with clear, practical examples and tips—perfect for beginners and pros who want to write better queries and optimize databases.
B2B SaaS Metric Tree
A full B2B Metric Tree.
Product Onboarding Funnel
Visualize an entire product funnel with screenshots and live data to find where you're losing users and why
The Ultimate Guide to Hiring your Data Team
Every useful resource in the data community about hiring people to join your data team, all in one canvas.
Duolingo's B2C Growth Model
Map out your B2C company's growth model with live data in this canvas inspired by Duolingo.
MoonPay's B2C App Metric Tree
See exactly why revenue moves. Map all your B2C metrics into one hierarchical tree to pinpoint issues fast, align teams, and tie every change back to revenue.
Customer Journey Map
Build a shared understanding of the lifecycle customers move through with metrics and analysis.
Scenario Modeling Metric Tree
Use predictive sliders in a metric tree to quickly visualize the impact of different scenarios on business outcomes.
Cash Flow Map
Visualize company finances as a true flow and simplify reporting.
GA4 Website Analytics Metric Map
A metric map of your GA4 data to show how your website activity impacts your overall business goals.
Live NPS Exploration
Bring all your data together in a single view to serve better customer insight to all of your teams.
Product Alignment Canvas
Map out how four "stream teams", or smaller product teams, can own core metrics that ladder up to an organization-level North Star.
Marketing Campaign Dashboard
Monitor your marketing campaign performance with this traditional dashboard canvas.
Product Feature Usage Map
Map your product features into a hierarchical format to explore usage and pinpoint opportunities to improve usability and adoption.
Simple Revenue Metric Tree
A simple metric tree breaking down revenue into typical B2B SaaS components of new business, expansion, contraction, and churn.