Make your business visible so your people can make it better
Count is the only BI tool that lets you visualise complex systems as metric trees and maps.


“The infinite canvas really frees you up to explore and think through metrics or complex analysis and then easily communicate complex information after the fact. Count was great for developing our first north star product metrics and metric trees. ”
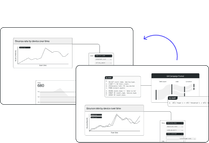
Layout your business, not just your metrics
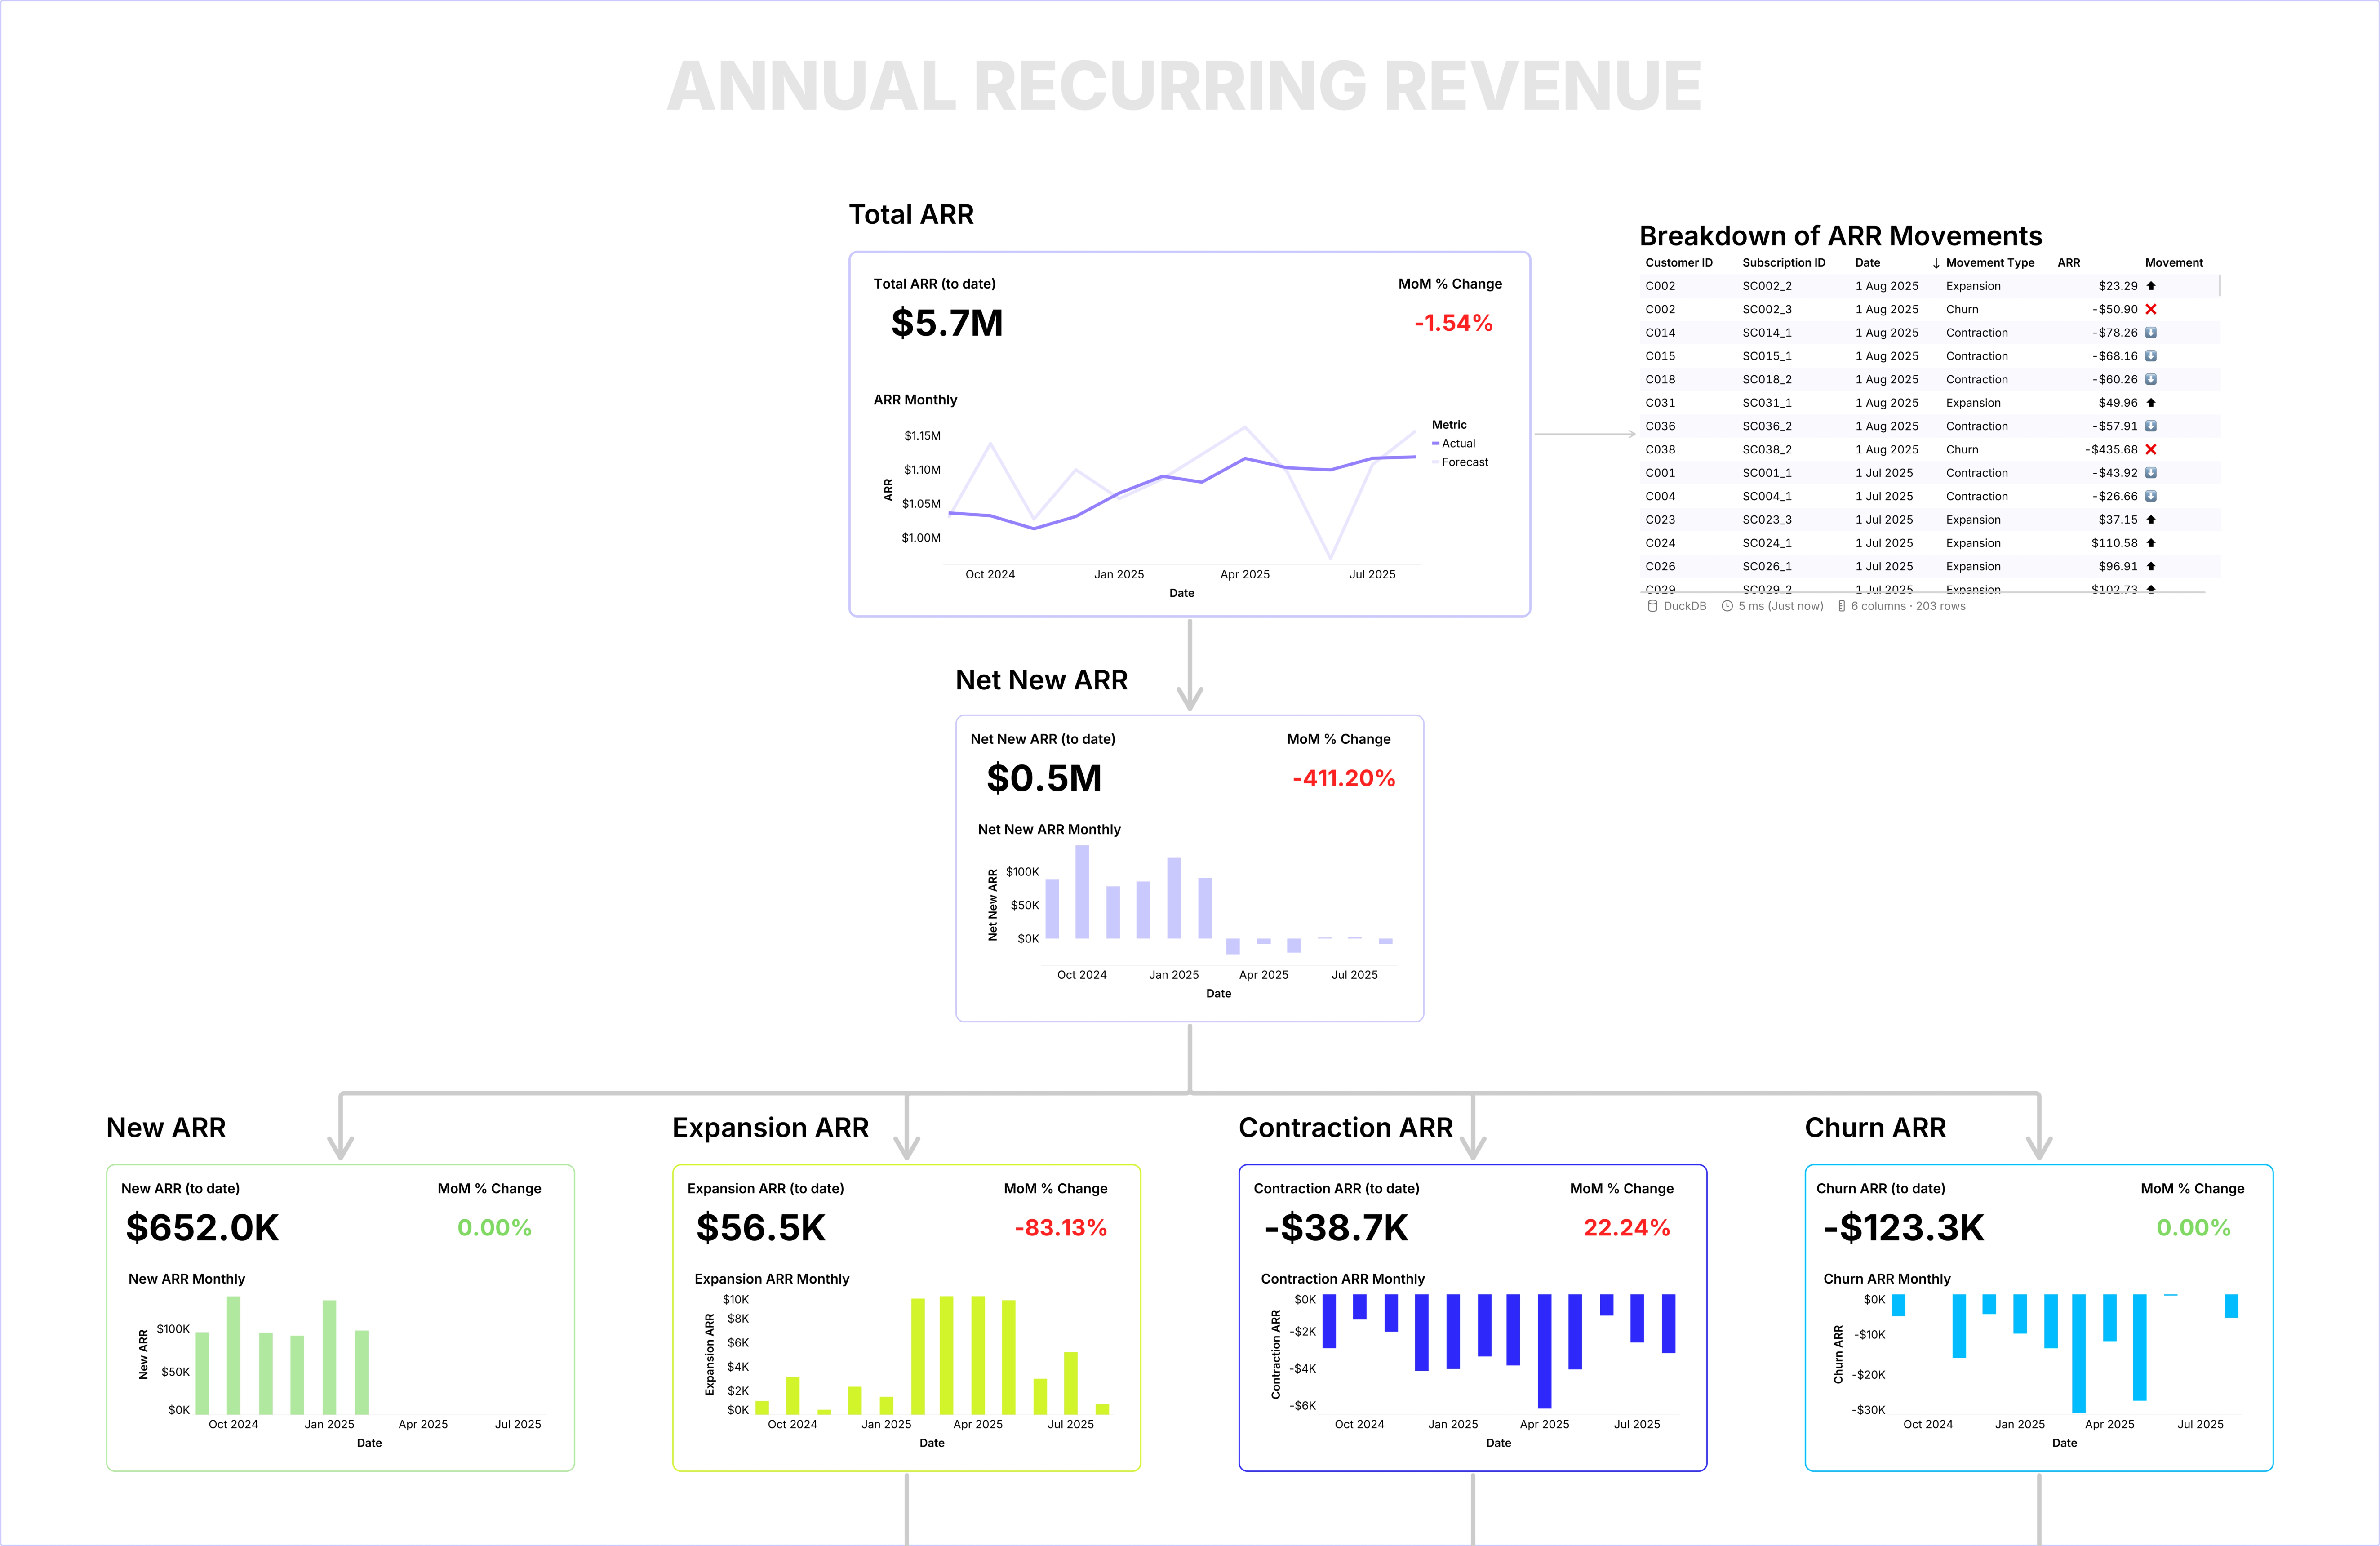
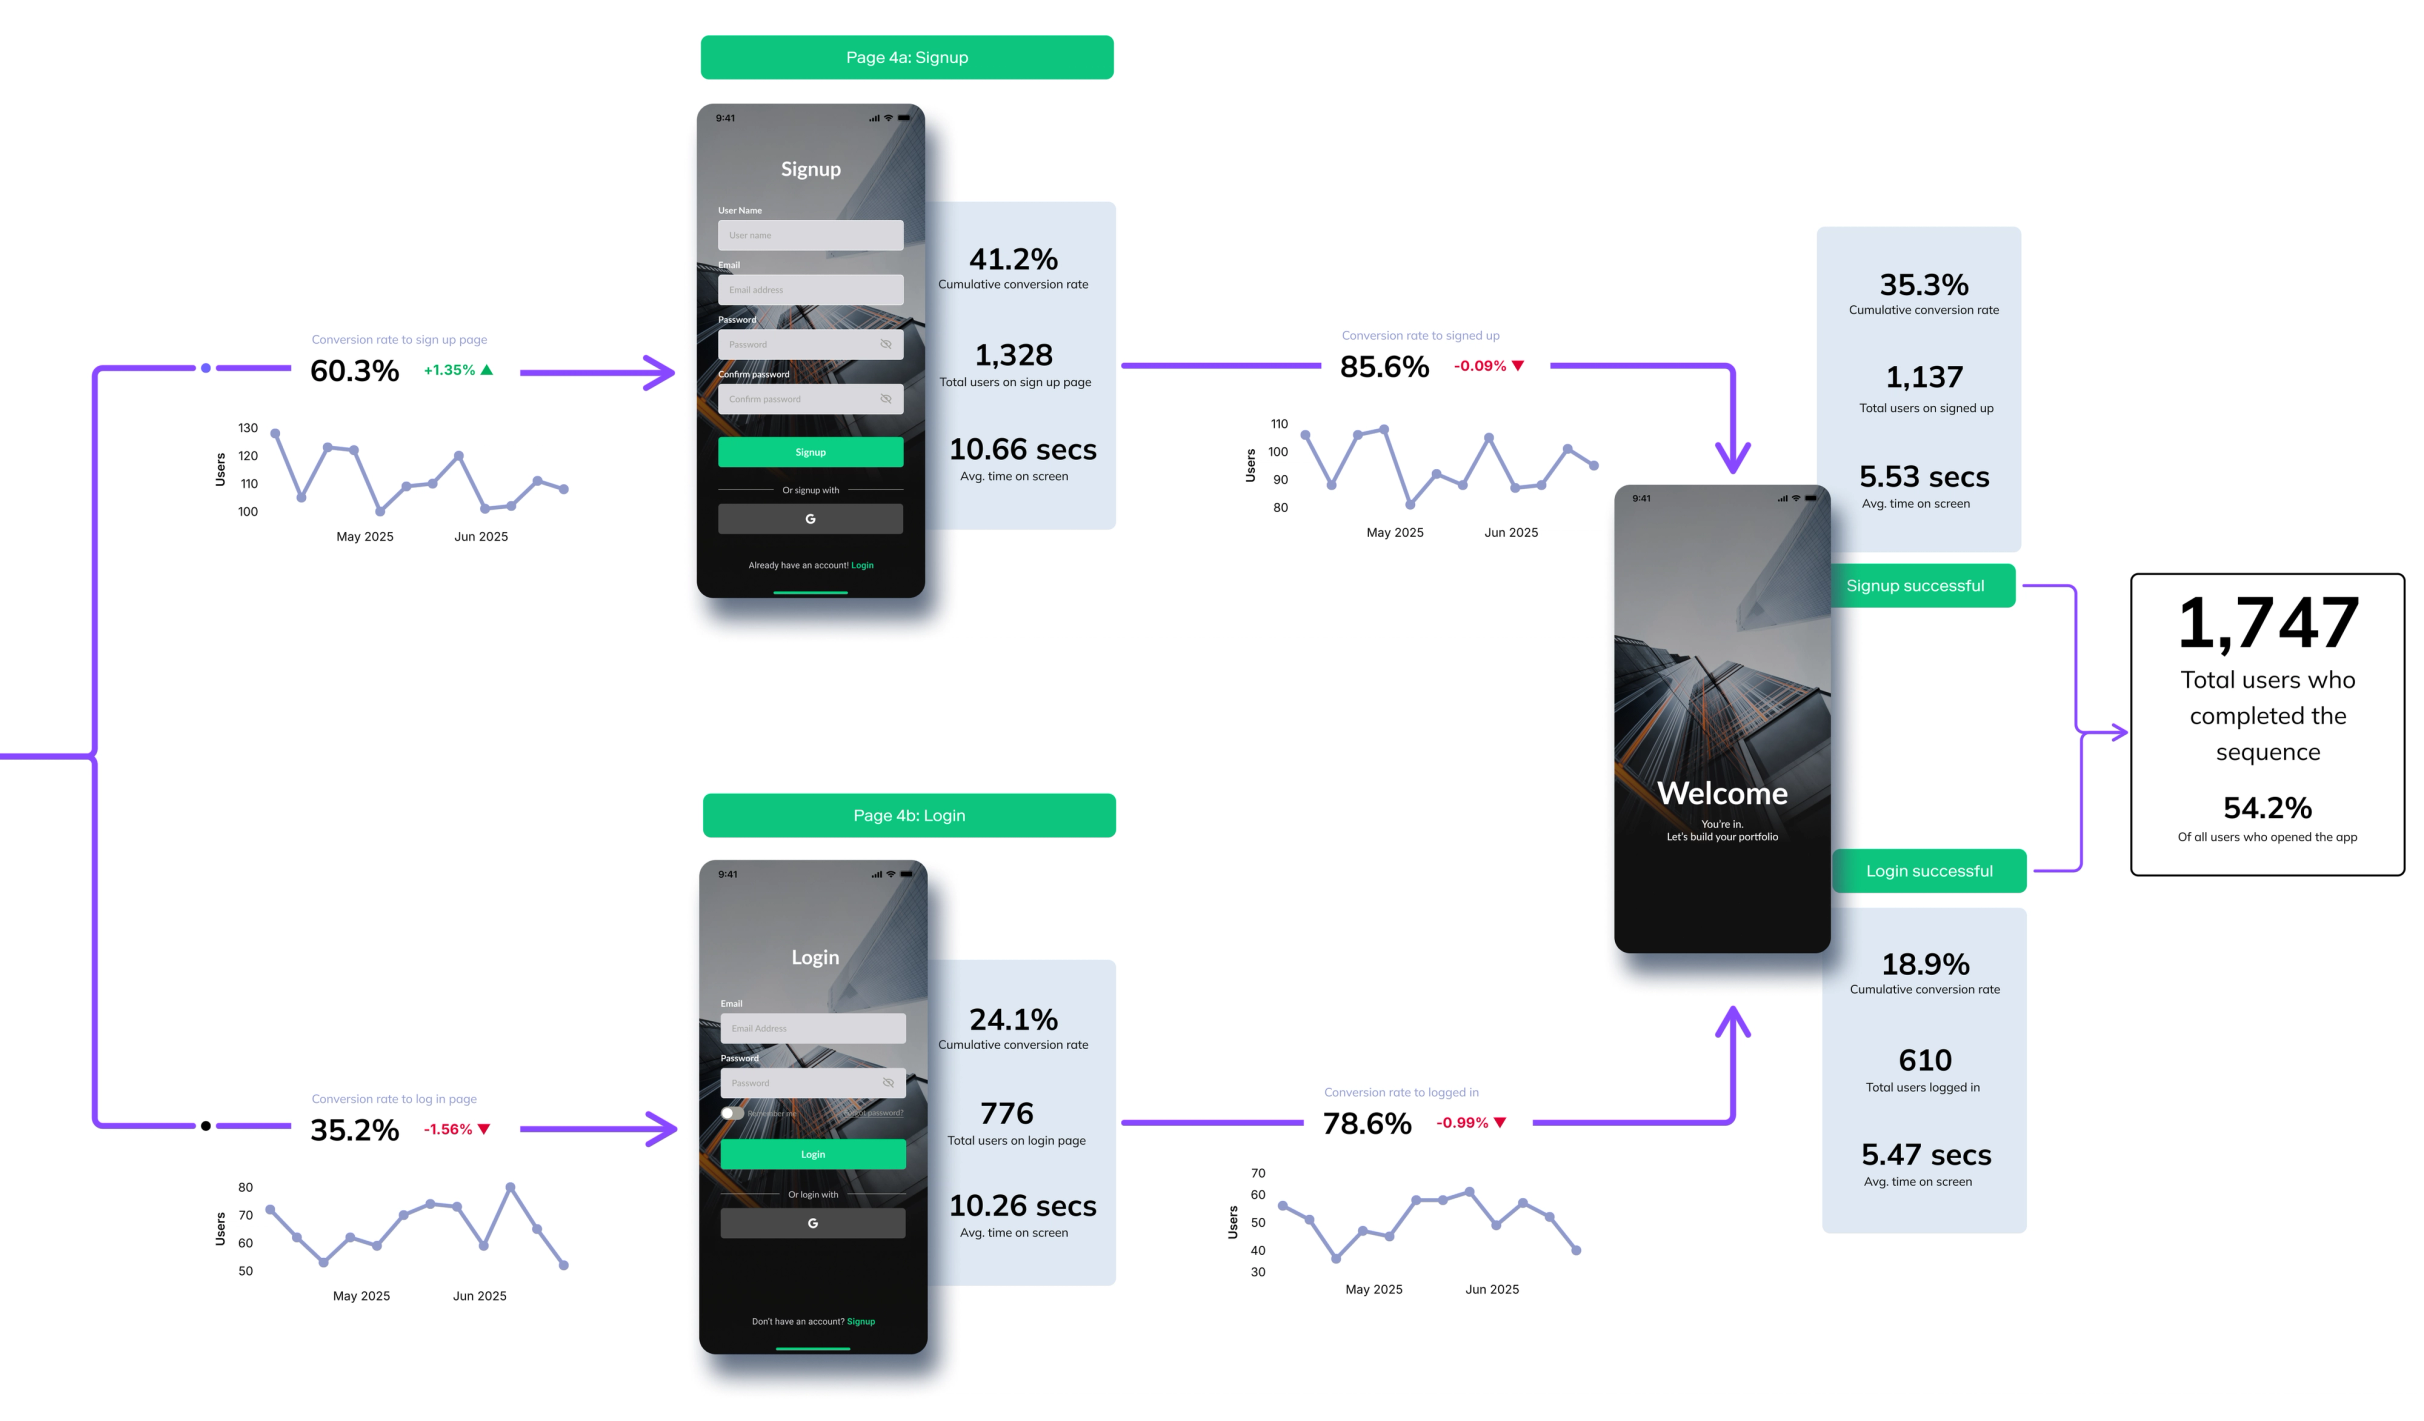
Bring clarity to customer journeys and conversion flows by combining images, data visualizations, and annotations in layouts that people can follow and understand intuitively.
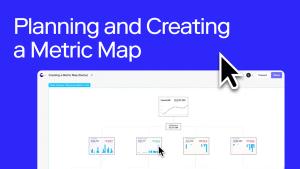
Break down metrics to speed up action
Use metric trees to decompose your core metrics into the leading and lagging measures that your teams can actually directly influence, so they can get to what matters and making decisions quicker.
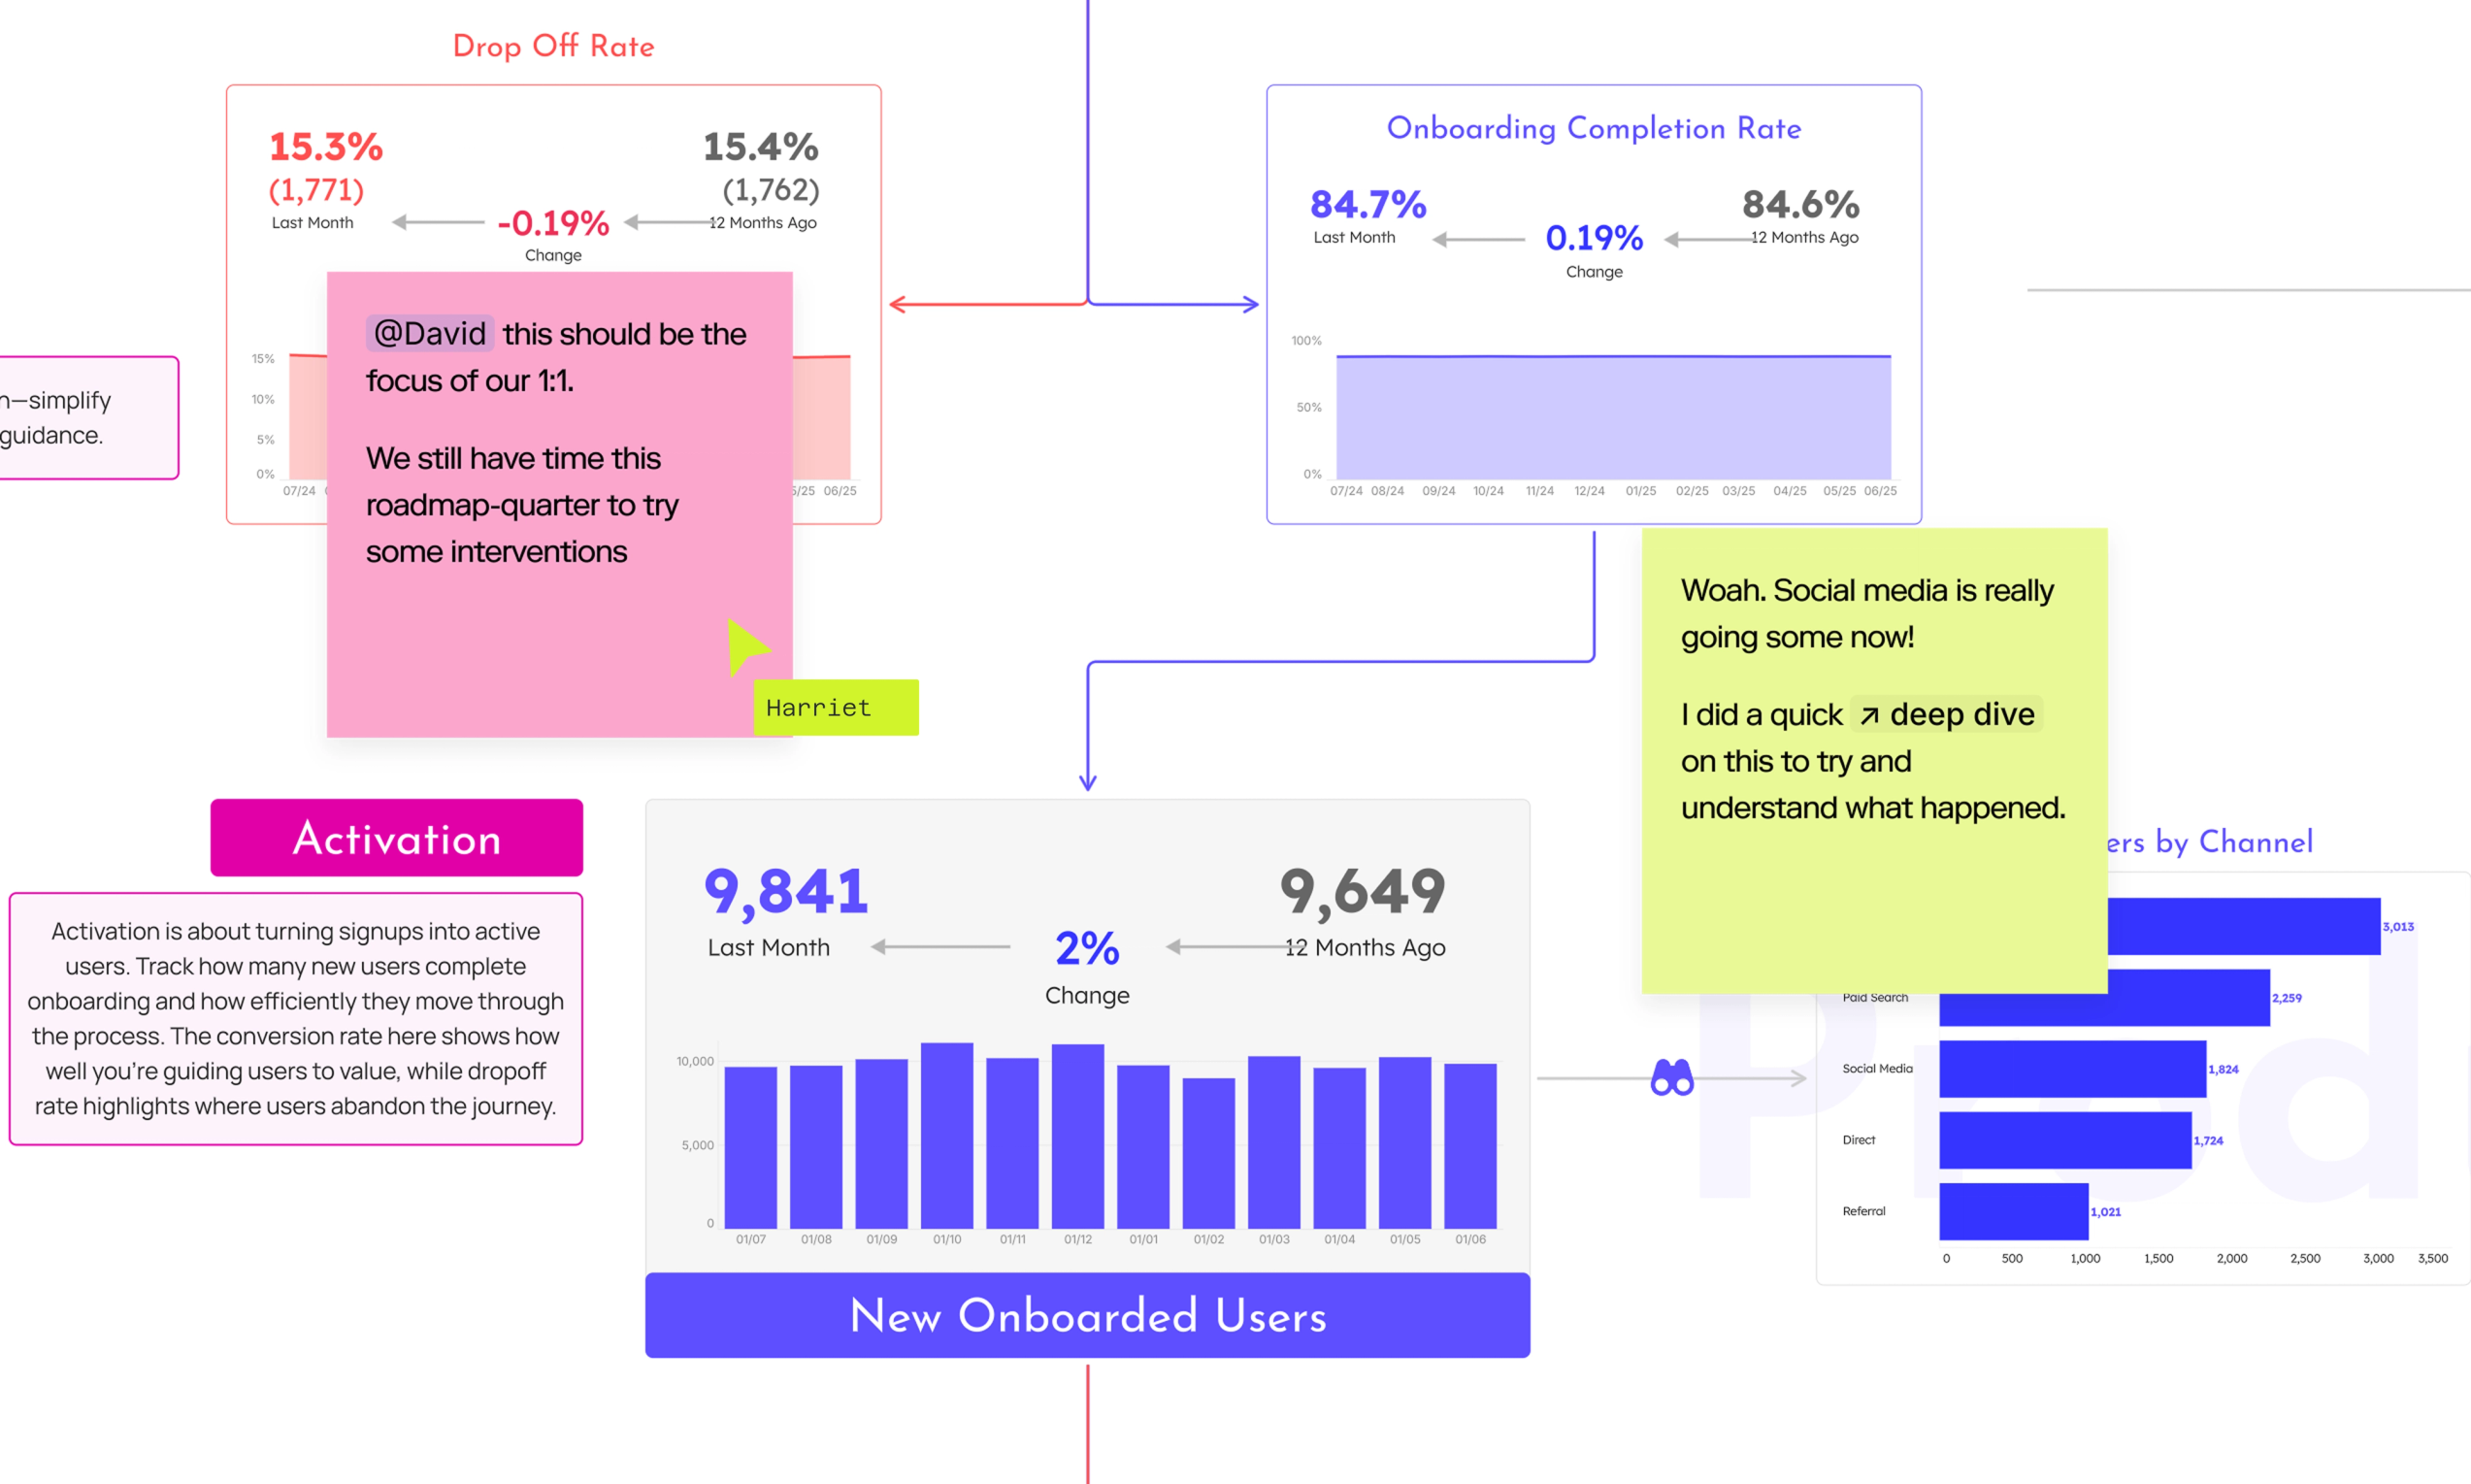
Your collaborative command centre
Make a metric map that becomes your team's secret weapon. All their key data and conversations made visible and actually useful.
Create components and templates or use ours

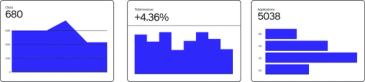
Combine and compose visualisations to create consistent and reusable metric cards
Version tracking and full canvas history
Filter data across the entire canvas with interactive controls

Let explorers dive in and manipulate read-only visuals

Related Resources

Frequently Asked Questions
Over half of organizations juggle six or more dashboards daily, with a quarter navigating more than eleven dashboards just to understand what's happening in their business.
The result? Confusion, inefficiency, and an unclear understanding of growth drivers.
Metric trees solve this by condensing multiple dashboards into a single, clear view that pinpoints exactly what matters most.
The goal of metric maps—and the bar to which they must be held in order to remain effective—is to not just create but to maintain “operational clarity” for individuals, teams, and the organization. By this we mean that they:
- Permit people to make decisions and actions with more confidence and conviction, built on a foundation of organization-wide awareness
- Build an ever- and self-deepening awareness of how the organisation works and reacts to change
- Make the invisible in data and context alike, visible to all, and open for investigation by all.
In short, they should help visualise the business, not just the metrics.
Traditional BI tools largely focus on visualizing data in ways that are abstracted from the business process that generated it. They also struggle to capture the relationship between one and metric and another. The result is that awareness and understanding across the business suffers, and people are less able to identify emerging issues or act upon them, even if they actually have direct control over a contributing factor. Making how a business works clearer and simpler invites better and wider introspection, aligns teams and effort, and rapidly speeds up onboarding new colleagues and stakeholders into the business' fundamental models.
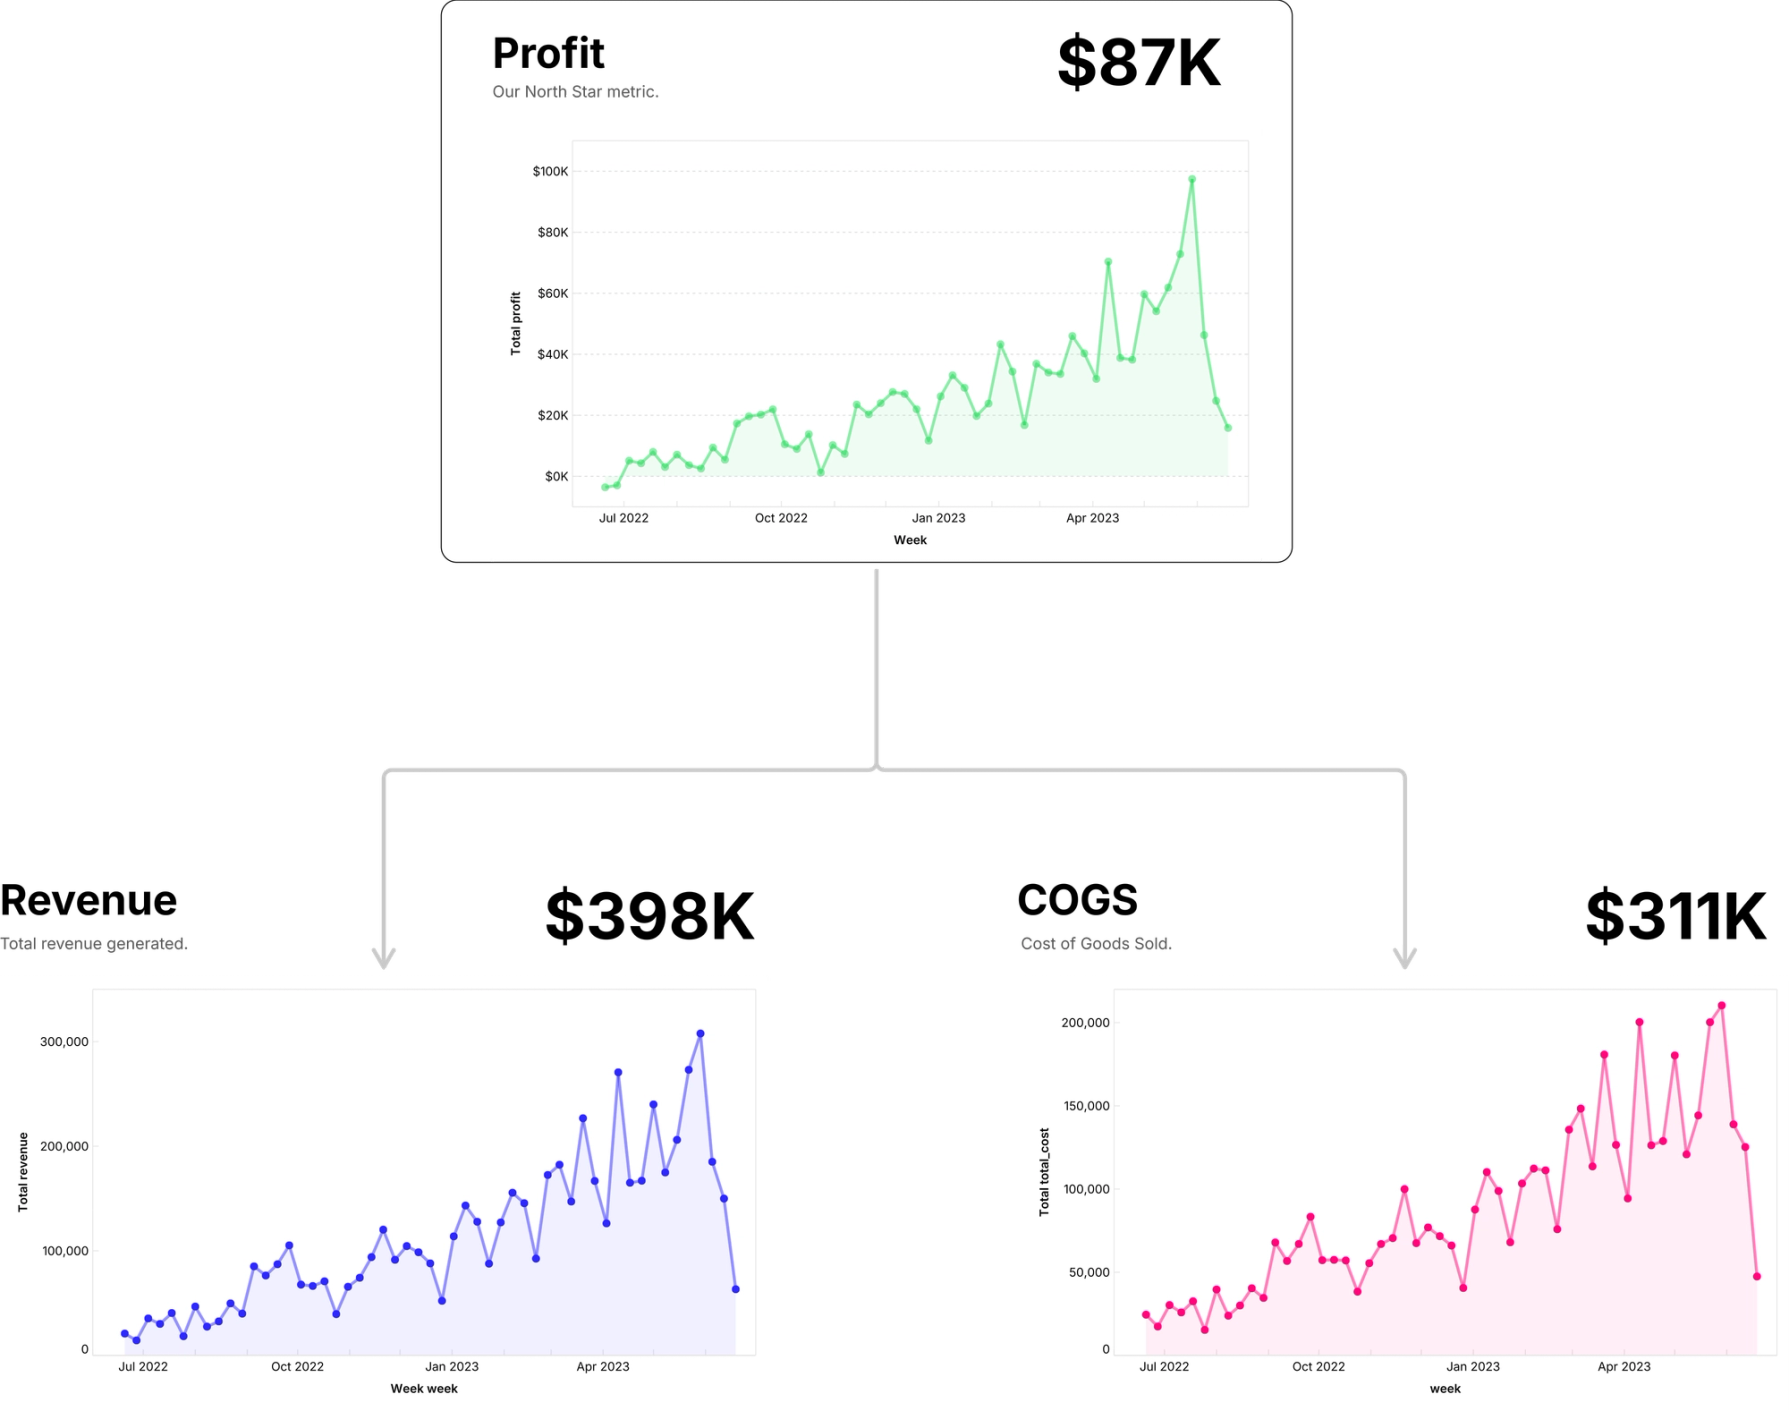
Metric trees clarify the relationships between metrics by showing them in a tree structure. Each layer is decomposed below itself into the metrics that drive it, for instance showing that profit is really just a function of revenue and cost of goods sold.
Metric trees are a powerful way of building understanding of your core company metrics, helping people make quicker decisions, and acting on them.