Your Revenue Dropped 8%. But You Have No Idea Why.
It's Monday morning. Your CFO pings leadership: "Revenue is down 8% from last month. What happened?"
Someone checks the product analytics. MAUs are actually up 3%. So... not a user acquisition problem?
Someone else checks the payment processor. Transaction volume looks normal. Not fewer transactions.
Your finance team digs into margin data. COGS are stable. Gross margin hasn't shifted.
Two hours and five different dashboards later, you still don't know. Is it a customer problem? A transaction problem? A margin issue? Did success rates drop? Did ARPU decline? Is it returning users or new user onboarding?
By the time you narrow down the problem space, you've burned half a week. By the time you actually fix it, the month's over.
This is what happens when your growth model lives across multiple systems instead of in a single, hierarchical view. You have all the metrics. You just can't see how they connect.
The Metric Maze Problem
Fintech and crypto companies feel this acutely. When you're processing thousands of transactions daily with volatile volumes, network fees, compliance costs, and success rate fluctuations, it's incredibly easy to get lost in the weeds.
Your product team tracks MAUs and MTUs. Your growth team monitors conversion and retention. Your payments team watches transaction volume and success rates. Your finance team calculates margin—gross margin, COGS percentage, net margin after fees.
All critical metrics. All living in different places. Amplitude for app growth. Your payment processor for transaction data. Your accounting system for financial metrics. Maybe a custom dashboard someone built six months ago that pulls from your data warehouse but nobody's quite sure how to update.
So when revenue moves—up or down—you can't rapidly diagnose why. You know that something changed. But which metric? Which branch of your growth model is broken?
Is it customer-focused? Fewer monthly transacting users? Lower onboarding conversion? Retention dropping?
Or is it transaction-focused? Lower average revenue per user? Transaction success rate declining? Margin compression from rising costs?
You start clicking through dashboards. Exporting CSVs. Building pivot tables. Asking six different people for their version of the data. And somewhere in that process, the simple question—"Why did revenue drop?"—becomes a multi-day investigation.
Moonpay—a crypto payments company processing millions in transaction volume—figured out this doesn't scale.
What Moonpay Built Instead
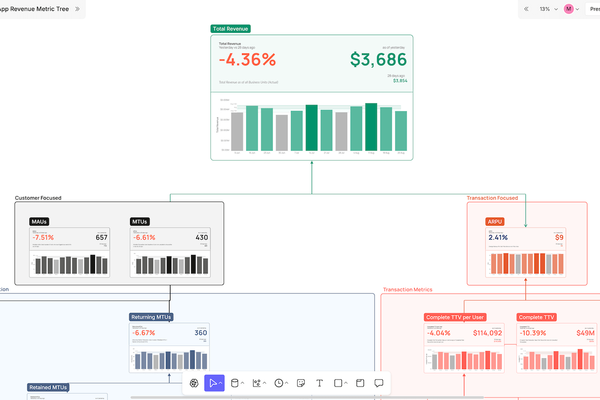
Moonpay's growth model is a hierarchical metric tree. Total revenue at the top. Two branches below: customer-focused metrics and transaction-focused metrics.
Customer branch: MAUs and MTUs breaking down into onboarding flows (how many users activate?) and retention models (how many come back and transact again?).
Transaction branch: ARPU breaking down into transaction volume, transaction value, success rate, and net margin (gross margin minus COGS percentage).
Every metric feeds up. Every change rolls up to revenue. And when revenue moves, you can see exactly which part of the model is driving it.
Count's B2C metric tree canvas is a replica of Moonpay's internal model. Map your customer-focused metrics—acquisition, activation, retention—alongside your transaction-focused metrics—volume, value, success rates, margin economics. Connect them hierarchically so you can see how they interact to drive growth. Pull from your data warehouse so everything updates automatically.
Which is a fancy way of saying: when revenue drops 8%, you'll know why in two minutes instead of two days.
Your growth PM spots it immediately: transaction success rate dropped from 94% to 89%. Not a customer problem—you have plenty of users. Not a volume problem—transactions are up. It's operational. Payment gateway issues. Network congestion. Something fixable.
Or maybe it's the opposite: success rate is fine, but returning user transactions are down 15%. Now it's a retention problem. Product issue. Customer satisfaction. Different fix entirely.
Same revenue drop. Completely different root cause. And you know which one because your metrics are structured to show you.
From Guesswork to Growth Intelligence
Here's what changes when your growth model is a unified tree:
Cross-functional alignment happens naturally. Product, growth, payments, finance—everyone sees the same metrics, structured the same way. No more "my dashboard says X but your dashboard says Y."
You pinpoint problems fast. Revenue changes. You look at the tree. Customer branch is fine. Transaction branch shows success rate declining. Done. You've narrowed the problem space from "everything" to "payment infrastructure" in 30 seconds.
You tie changes back to revenue immediately. Someone suggests improving onboarding conversion. Cool. Look at the tree. See exactly how much that lever moves total revenue versus improving transaction value or reducing churn.
The reality is: B2C transactional businesses have complex growth models. Customer acquisition matters. Retention matters. Transaction volume matters. Transaction success matters. Margin matters. They all interact. They all drive revenue.
But when those metrics live in isolation, you're flying blind. You know revenue went up or down. You just don't know which part of your machine broke or improved.
Moonpay built their metric tree to solve this. You can build yours the same way.
Map your customer-focused metrics and transaction-focused metrics into one hierarchical canvas. Connect it to your data warehouse. Let your team see how every metric ladders up to revenue. And finally diagnose growth problems before they compound into quarterly misses.
