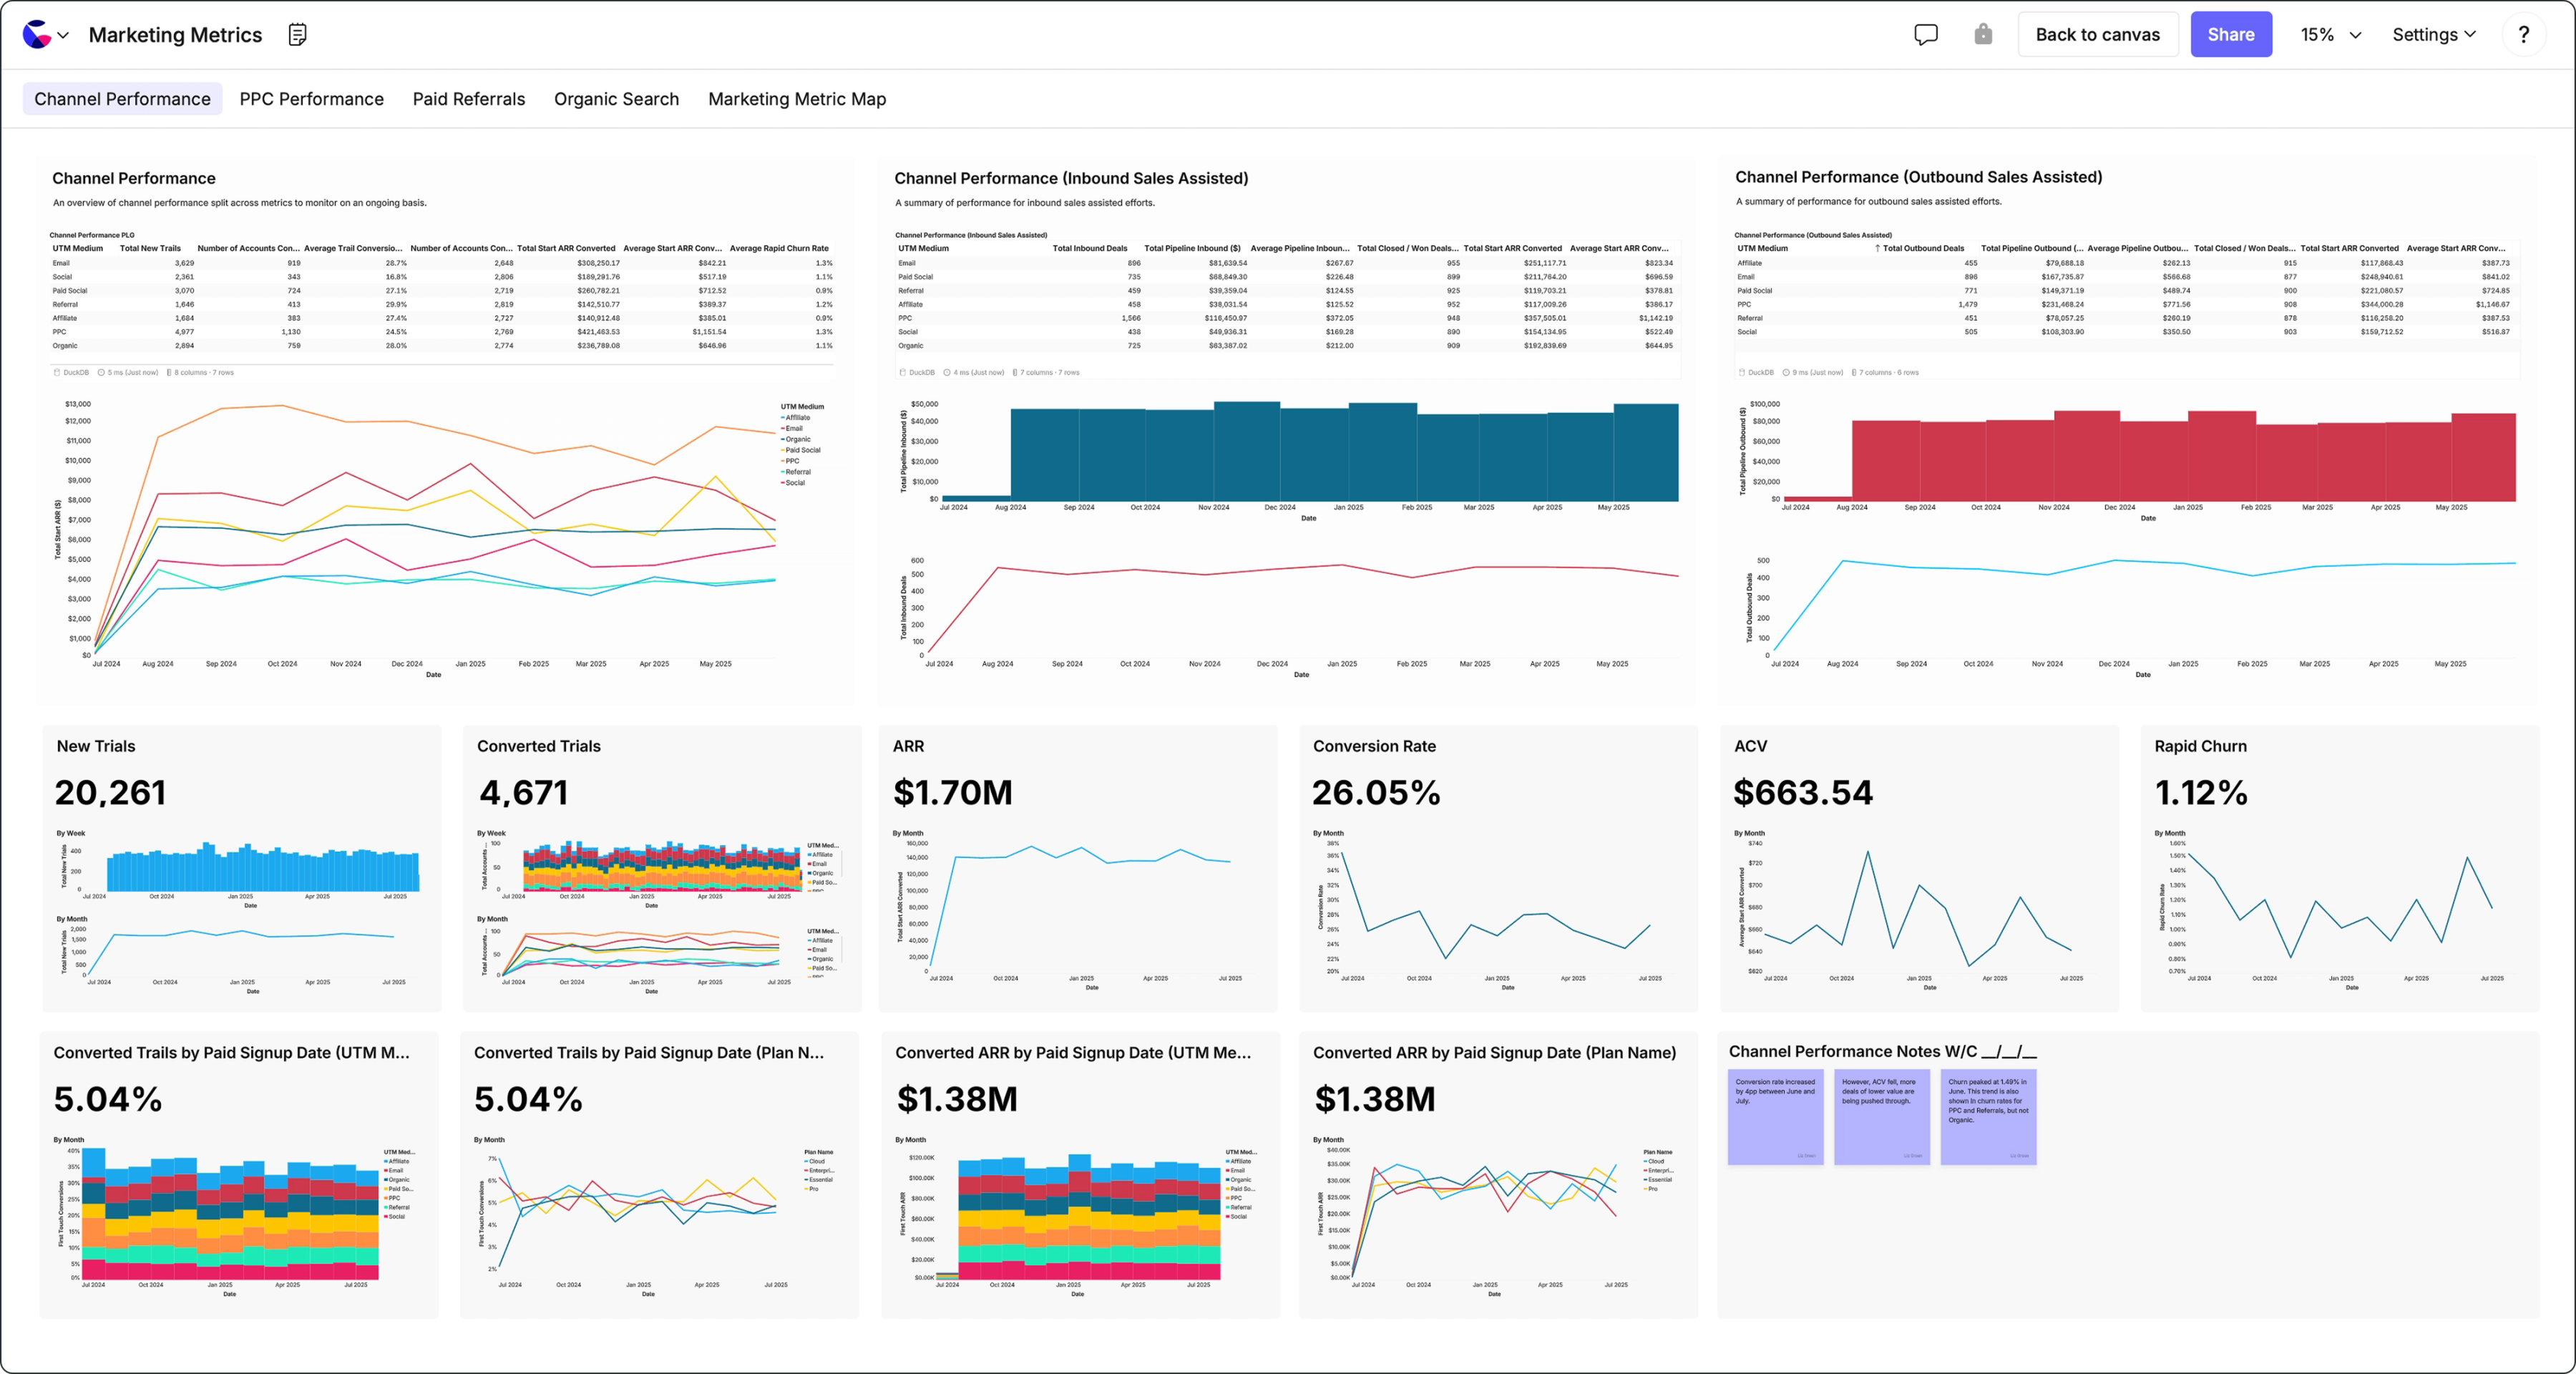
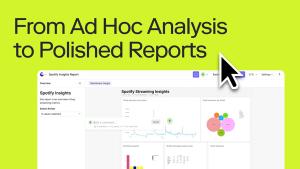
Simplify complex reporting so everyone can collaborate towards action
Build rich reports from your canvases that become living documents, not read-only dashboards.

“Some of our most important stakeholders are constantly busy and don't have the time to log in and go look at a dashboard so Count's alert system fixes this by delivering the dashboards directly to their email and slack.”
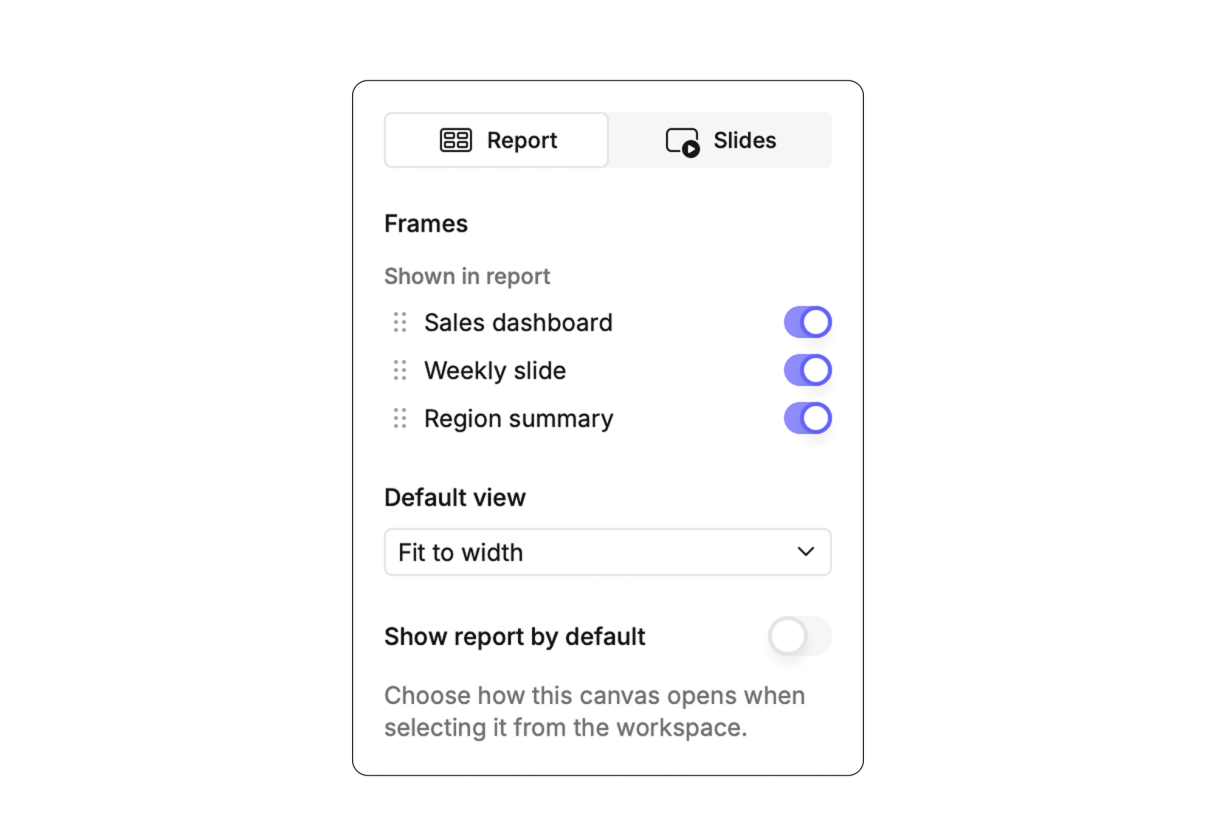
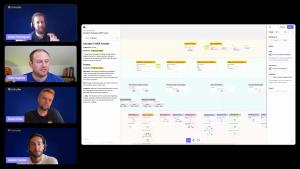
Present straight from the canvas
Use frames to split up your canvases into views for reporting. With a single click you can then create a beautiful live reporting page, or present in an optimised slide view perfect for wall screens and meetings alike.
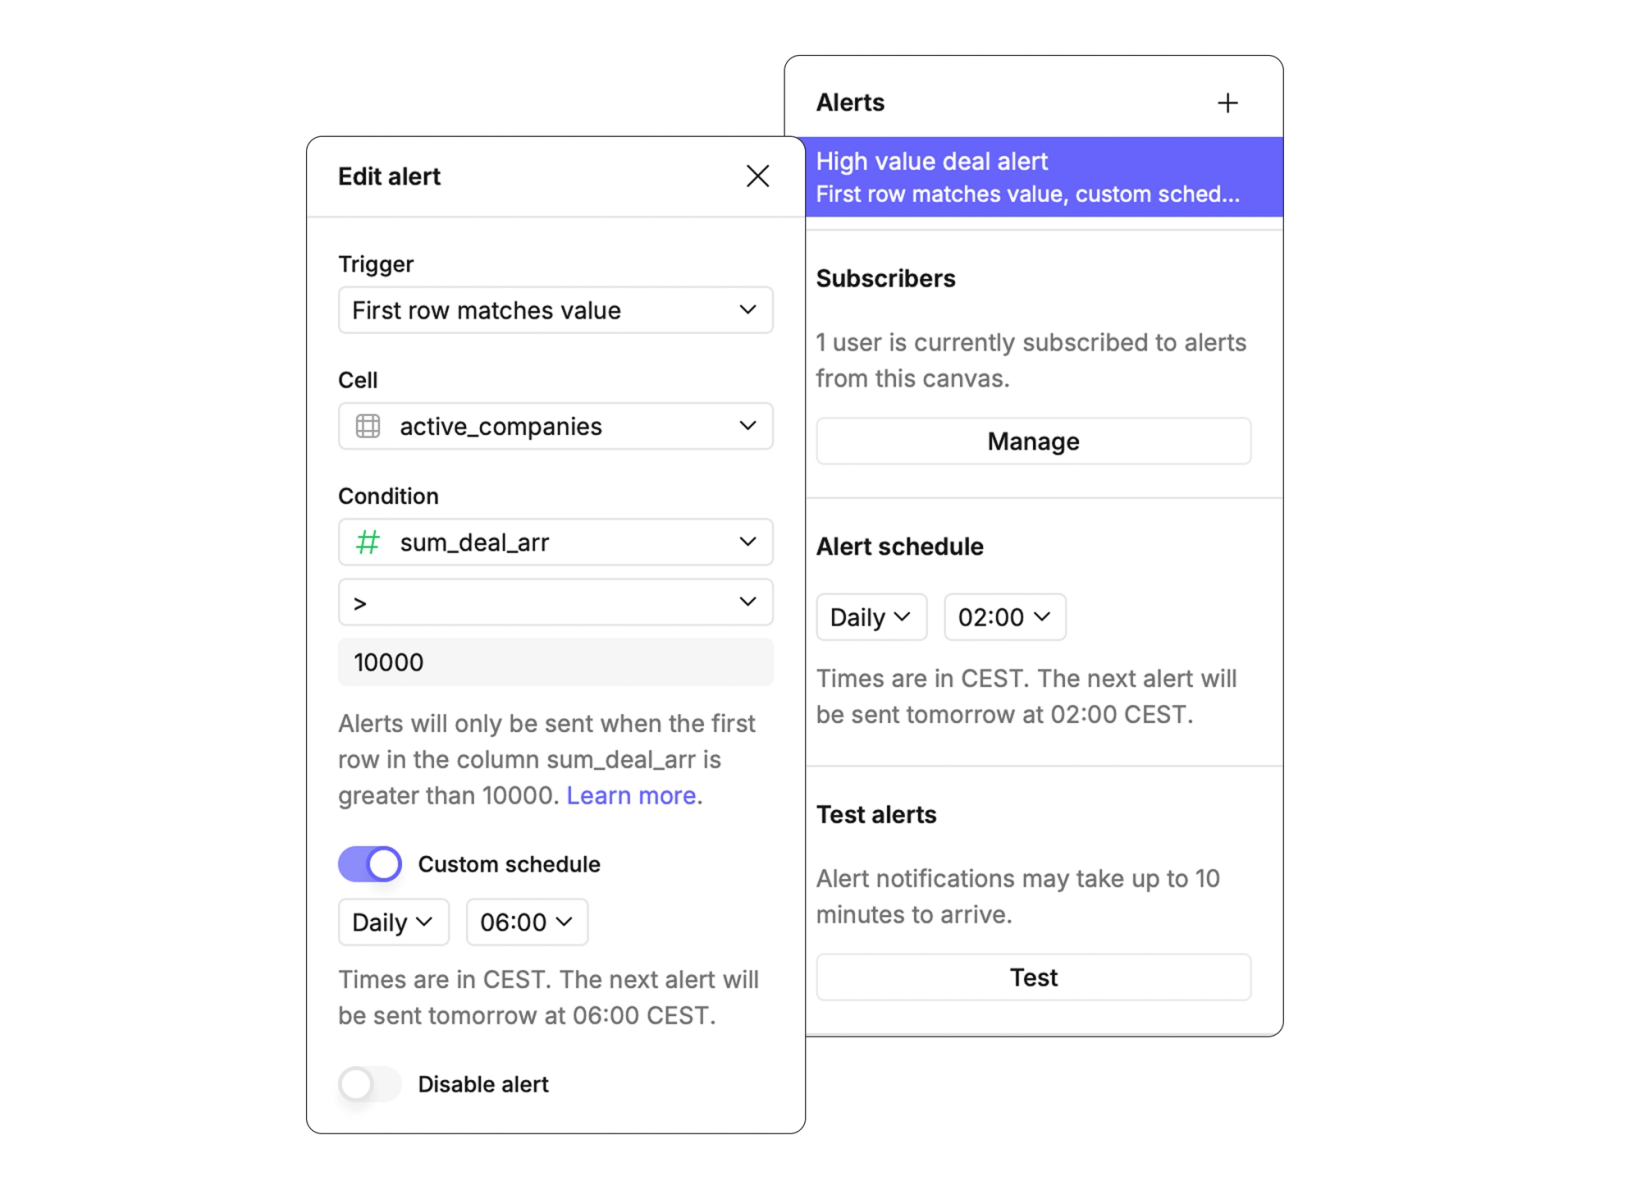
Insight when it matters
Set alerts in the canvas to send just the parts that matter to stakeholders over Slack or email. Alerts can be triggered by a schedule ("your Monday brief") or by changes in the data ("your uh-oh warning").
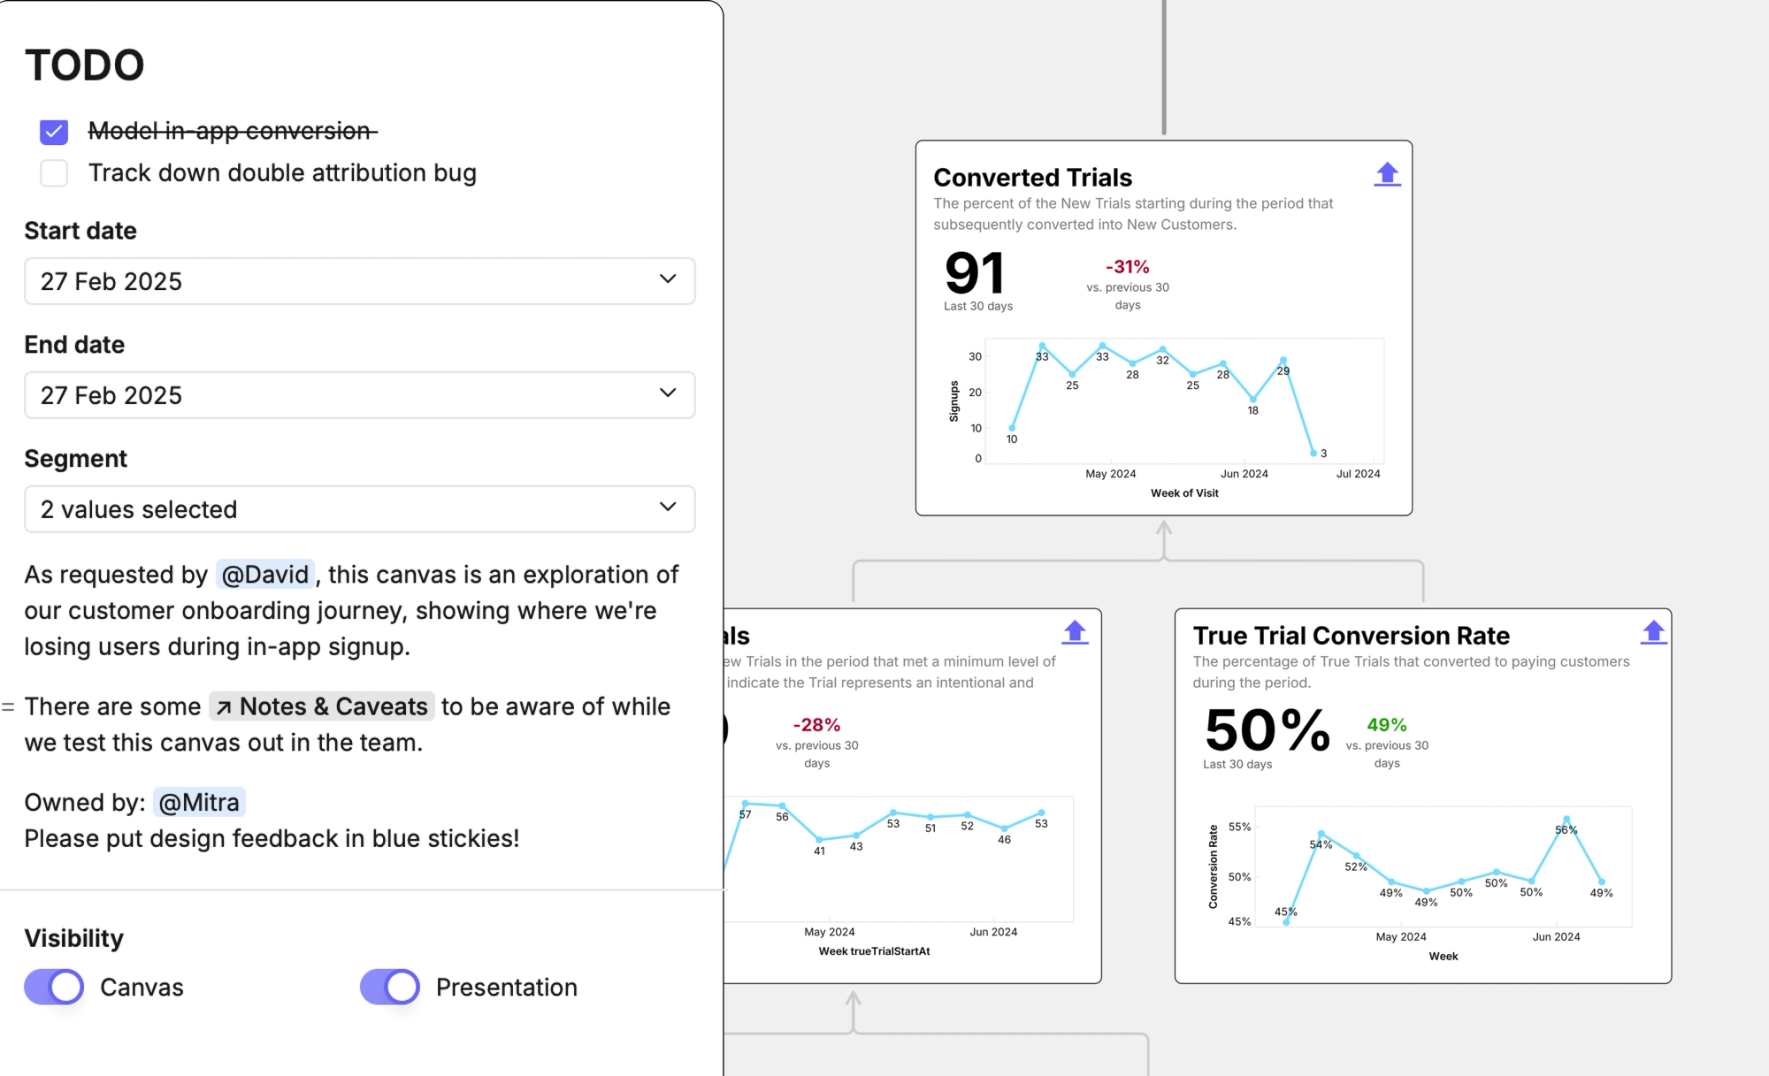
Keep reporting obvious
Use canvas overviews to help everyone understand and engage with reports. You can track tasks, communicate governance concerns, and put all the key global filters in a single pane that everyone sees.
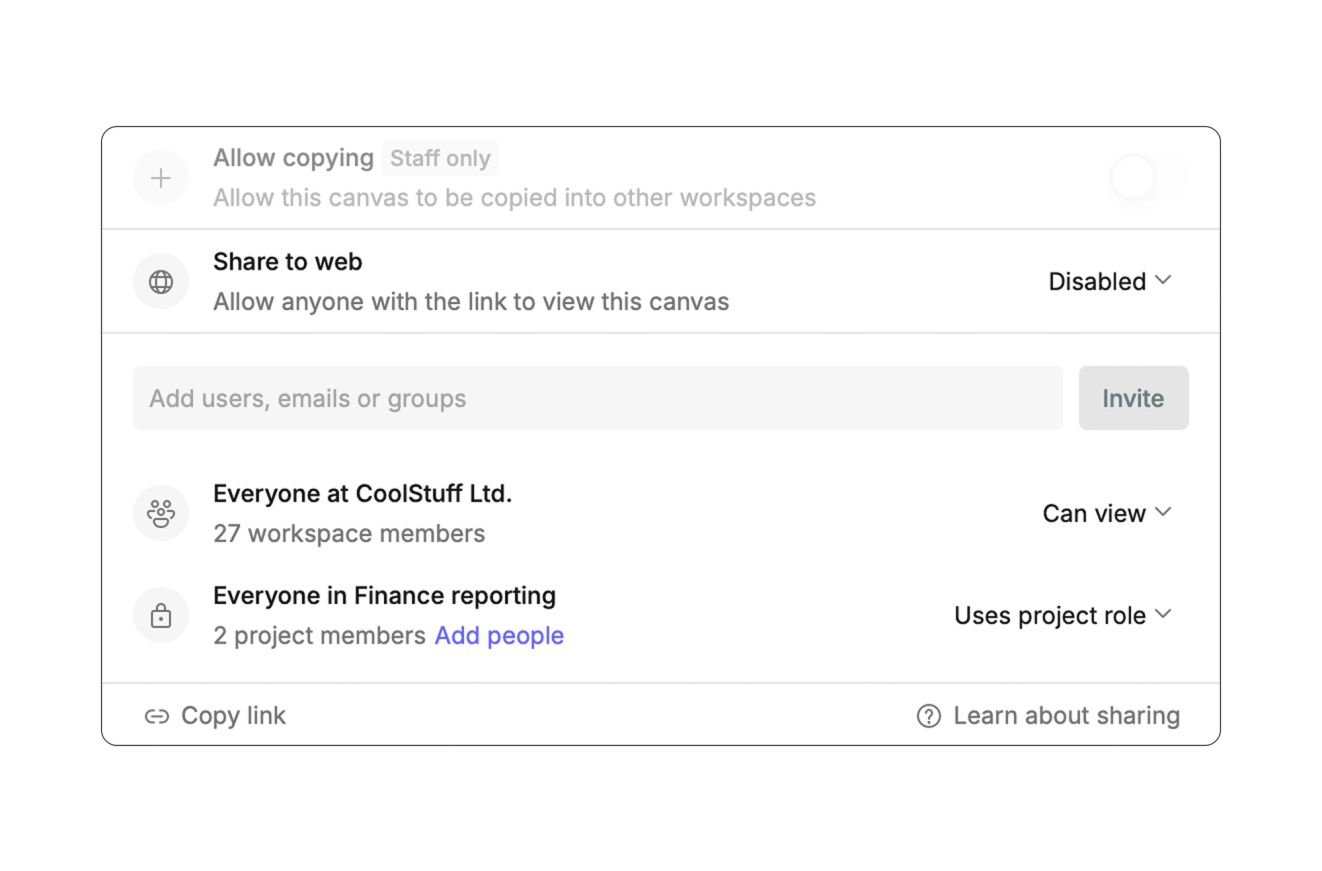
Share canvases and reports with fine-grain controls
Folders, Projects, Group, and Permissions let you decide who can see or collaborate with canvases. You can also share report presentations directly and prevent people from seeing the source canvas.
And everything else that makes people actually engage with reports
Dive in to any visual or table to explore further in a no-code, no-worries playground
Export CSVs, PNGs, or PDFs for whole canvases, frames, or individual cells
...or turn that off for more sensitive information
Add canvases and reports to internal pages with simple iframe embedding
Lock canvases to let every viewers filter and explore without disturbing others.
Related Resources
Frequently Asked Questions
Yes, Count supports scheduled query execution at the canvas level and scheduled alerts/subscriptions for specific parts of your canvas. Configure schedules using simple intervals or custom cron expressions for flexible timing.
Yes, Count has a Slack app for sending alerts and subscriptions to channels. You can schedule alerts from cells, visuals, frames, or reports to be sent via Slack or email on custom schedules or when thresholds are exceeded