How to integrate Google Analytics with Count for better marketing dashboards
Written by David Tomasoni-Major
David Tomasoni-Major explains how to turn GA4 data in your warehouse into flexible, self-serve marketing dashboards using Count’s semantic layer.
Marketing teams live in Google Analytics. It's where they track campaigns, measure engagement, and prove ROI. But GA4's interface has limitations—rigid report structures, awkward comparisons between time periods, and an inability to blend analytics data with other business metrics.
This is where Count transforms GA4 data into something far more powerful. By connecting your Google Analytics data to Count and modelling it with Count Metrics (Count's powerful semantic layer), you gain all the familiar metrics and dimensions from GA4, but with the flexibility to combine, visualize, and analyze them in ways the native interface simply can't support.
Why Bring GA4 Data Into Count?
Before diving into the technical setup, it's worth understanding what you gain:
Go beyond GA4's report limitations. Create custom metric trees that show exactly how website activity converts to business outcomes. Compare multiple time periods side-by-side. Blend web analytics with CRM, product, and revenue data in a single view.
Give marketing teams self-service access. With Count Metrics defining consistent calculations, marketers can explore data freely without worrying about writing incorrect SQL or misinterpreting raw event tables.
Build a single source of truth. Rather than having marketing metrics siloed in GA4 while sales looks at CRM data and finance tracks revenue separately, Count brings everything together. Define "conversion" once and use it everywhere.
Unlock faster exploration. Count's DuckDB browser and server functionality means you can explore millions of rows of GA4 data with sub-second response times—no more waiting for GA4 reports to load.
Step 1: Ingesting GA4 Data to Your Warehouse
Unfortunately, you can't query GA4 data directly from Count—you need to first ingest it into your data warehouse. The good news? All major warehouse providers have solved this problem:
BigQuery (Recommended for GA4)
Google Cloud offers the most seamless integration since GA4 and BigQuery are both Google products:
- In your GA4 property, go to Admin → BigQuery Links
- Configure a daily export to your BigQuery project
- Choose whether to export streaming data (real-time, costs more) or daily batches (free)
- Data will appear in a new dataset with tables named
events_YYYYMMDD
Cost consideration: The daily export itself is free, but you'll pay standard BigQuery storage and query costs. For most teams, this runs $50-200/month depending on traffic volume.
Snowflake
If your data warehouse is Snowflake:
- Visit the Snowflake Marketplace
- Search for "Google Analytics 4" connectors—several vendors offer managed options
- Popular choices include Fivetran, Airbyte, and native Snowflake connectors
- Follow the provider's setup wizard to authenticate and configure sync frequency
Note: Most Snowflake connectors require a paid plan with the connector provider, though many offer free trials.
Redshift/AWS
For AWS-based data warehouses try AppFlow:
- Use AWS AppFlow to create a connection to GA4
- Configure AppFlow to write data to Redshift, S3, or other AWS destinations
- Set your sync schedule (daily is typical for GA4)
- Optionally, use dbt or other transformation tools to model the data after landing
Alternative: You can also use third-party ETL tools like Fivetran or Airbyte to sync GA4 to Redshift, which often provide more flexible transformation options.Step 1: Ingesting GA4 Data to Your Warehouse
Step 2: Understanding the GA4 Data Model
Once data is in your warehouse, you'll find it's quite different from traditional analytics schemas. GA4 uses an event-based model where almost everything is an event:
- Page views are
page_viewevents - Clicks are events
- Form submissions are events
- Conversions are marked as events with
is_conversion_event = true
Each event has:
- Event parameters (like
page_location,page_title, nested in a repeated field) - User properties (like
geo.country,device.category) - Ecommerce parameters (for purchase events)
- Traffic source dimensions (like
traffic_source.medium)
This structure is powerful but not intuitive for marketers used to GA4's interface. This is exactly where Count Metrics shines.
Step 3: Modelling with Count Metrics
Once you have the data in your warehouse, it's easy to turn it into a catalog that you can add to marketing projects in the Count workspace.
To jump start, here are a set of basic definitions for views and datasets:
The following examples are written for BigQuery GA4 transfers
The FROM clause matches the way that BigQuery names datasets and some of the SQL-syntax may be BQ-specific.
name: ga_sessions
label: "[GA] Sessions"

caching:
  duration: 100000
  schedule: 40 * * * *

source:
  connection: <your connection key>
  query: select * from sessions
  dependencies:
    - name: sessions
      connection: <your connection key>
      query: |-
        SELECT session_campaigns.ga_session_id, session_campaigns.user_pseudo_id, session_engagement.sessions, engaged_sessions, bounces, campaign, medium, source, page_referrer, session_campaigns.landing_page, channel, session_engagement_time.engagement_time
        FROM session_campaigns
        join session_engagement_time on ga_session_id = concat(session_engagement_time.user_pseudo_id, session_engagement_time.session_id)
        join session_engagement on session_engagement.ga_session_id = session_campaigns.ga_session_id

    - name: session_engagement
      query: |-
        select
        concat(user_pseudo_id,(select value.int_value from unnest(event_params) where key = 'ga_session_id')) as ga_session_id,
        count(distinct concat(user_pseudo_id,(select value.int_value from unnest(event_params) where key = 'ga_session_id'))) as sessions,
        count(distinct case when (select value.string_value from unnest(event_params) where key = 'session_engaged') = '1' then concat(user_pseudo_id,(select value.int_value from unnest(event_params) where key = 'ga_session_id')) end) as engaged_sessions,
        count(distinct concat(user_pseudo_id,(select value.int_value from unnest(event_params) where key = 'ga_session_id'))) - count(distinct case when (select value.string_value from unnest(event_params) where key = 'session_engaged') = '1' then concat(user_pseudo_id,(select value.int_value from unnest(event_params) where key = 'ga_session_id')) end) as bounces,
        from
          `analytics_433661858.events_*`
        where
          _table_suffix between format_date('%Y%m%d', date_sub(current_date(), interval 180 day)) and format_date('%Y%m%d',current_date())
        group by ga_session_id
      connection: mLIr75dkD6r

    - name: session_engagement_time
      query: |-
        with prep as (
        select
            user_pseudo_id,
            (select value.int_value from unnest(event_params) where key = 'ga_session_id') as session_id,
            max((select value.string_value from unnest(event_params) where key = 'session_engaged')) as session_engaged,
            sum((select value.int_value from unnest(event_params) where key = 'engagement_time_msec'))/1000 as engagement_time_seconds
        from
        `analytics_433661858.events_*`
                where
                  _table_suffix between format_date('%Y%m%d', date_sub(current_date(), interval 180 day)) and format_date('%Y%m%d',current_date())
        group by
            user_pseudo_id,
            session_id)

        select
            user_pseudo_id, session_id,
            safe_divide(sum(engagement_time_seconds),count(distinct case when session_engaged = '1' then concat(user_pseudo_id,session_id) end)) as engagement_time
        from
            prep
            group by
            user_pseudo_id,
            session_id
      connection: mLIr75dkD6r

    - name: session_campaigns
      query: |-
        select
          user_pseudo_id,
          concat(user_pseudo_id, session_id) as ga_session_id,
          coalesce(campaign,'(not set)') as campaign,
          count(distinct concat(user_pseudo_id,session_id)) as sessions,
          medium, source,page_referrer, landing_page,
          case
          when (source is null or source = '(direct)') and (medium is null or medium in ('(not set)', '(none)')) then 'Direct'
          when campaign like '%cross-network%' then 'Cross-network'
          when (regexp_contains(source,'alibaba|amazon|google shopping|shopify|etsy|ebay|stripe|walmart')
          or regexp_contains(campaign, '^(.*(([^a-df-z]|^)shop|shopping).*)$'))
        and regexp_contains(medium, '^(.*cp.*|ppc|retargeting|paid.*)$') then 'Paid Shopping'
          when regexp_contains(source,'baidu|bing|duckduckgo|ecosia|google|yahoo|yandex') and regexp_contains(medium,'^(.*cp.*|ppc|retargeting|paid.*)$') then 'Paid Search'
          when regexp_contains(source,'badoo|facebook|fb|instagram|linkedin|pinterest|tiktok|twitter|whatsapp')
        and regexp_contains(medium,'^(.*cp.*|ppc|retargeting|paid.*)$') then 'Paid Social'
          when regexp_contains(source,'dailymotion|disneyplus|netflix|youtube|vimeo|twitch|vimeo|youtube') and regexp_contains(medium,'^(.*cp.*|ppc|retargeting|paid.*)$') then 'Paid Video'
          when medium in ('display','banner','expandable','interstitial','cpm') then 'Display'
          when regexp_contains(medium,'^(.*cp.*|ppc|retargeting|paid.*)$') then 'Paid Other'
          when regexp_contains(source,'alibaba|amazon|google shopping|shopify|etsy|ebay|stripe|walmart') or regexp_contains(campaign, '^(.*(([^a-df-z]|^)shop|shopping).*)$') then 'Organic Shopping'
          when regexp_contains(source,'badoo|facebook|fb|instagram|linkedin|pinterest|tiktok|twitter|whatsapp') or medium in ('social','social-network','social-media','sm','social network','social media') then 'Organic Social'
          when regexp_contains(source,'dailymotion|disneyplus|netflix|youtube|vimeo|twitch|vimeo|youtube') or regexp_contains(medium,'^(.*video.*)$') then 'Organic Video'
          when regexp_contains(source,'baidu|bing|duckduckgo|ecosia|google|yahoo|yandex') or medium = 'organic' then 'Organic Search'
          when medium in ('referral','app','link') then 'Referral'
          when regexp_contains(source,'email|e-mail|e_mail|e mail') or regexp_contains(medium,'email|e-mail|e_mail|e mail') then 'Email'
          when medium = 'affiliate' then 'Affiliates'
          when medium = 'audio' then 'Audio'
          when source = 'sms' or medium = 'sms' then 'SMS'
          when medium like '%push' or regexp_contains(medium,'mobile|notification') or source = 'firebase' then 'mobile push notifications'
          else 'Unassigned'
        end
          as channel,
        from
            session_campaigns_prep
        group by
            campaign,
            ga_session_id,
            user_pseudo_id,
            medium,
            source,
            page_referrer,
            landing_page,
            channel
        order by
            sessions desc
      connection: mLIr75dkD6r

    - name: session_campaigns_prep
      query: |-
        select
        user_pseudo_id,
        (
          select
            value.int_value
          from
            unnest (event_params)
          where
            key = 'ga_session_id'
        ) as session_id,
        array_agg(
          (
            select
              value.string_value
            from
              unnest (event_params)
            where
              key = 'campaign'
          ) ignore nulls
          order by
            event_timestamp
        ) [safe_offset(0)] as campaign,
        array_agg(
          (
            select
              value.string_value
            from
              unnest (event_params)
            where
              key = 'medium'
          ) ignore nulls
          order by
            event_timestamp
        ) [safe_offset(0)] as medium,
        array_agg(
          (
            select
              value.string_value
            from
              unnest (event_params)
            where
              key = 'source'
          ) ignore nulls
          order by
            event_timestamp
        ) [safe_offset(0)] as source,
        max(
          (
            select
              value.string_value
            from
              unnest (event_params)
            where
              key = 'page_referrer'
          )
        ) as page_referrer,
        case when (select value.int_value from unnest(event_params) where event_name = 'page_view' and key = 'entrances') = 1 then (select value.string_value from unnest(event_params) where event_name = 'page_view' and key = 'page_location') end as landing_page,

        from
          `analytics_433661858.events_*`
        where
          _table_suffix between format_date(
            '%Y%m%d',
            date_sub(current_date(), interval 180 day)
          ) and format_date('%Y%m%d', current_date())
        group by
          user_pseudo_id,
          session_id,
          landing_page
      connection: mLIr75dkD6r

fields:
  - name: ga_session_id
    type: string
    primary_key: true
    label: User Session ID
    description: The composite ID for a given user's session (User Pseudo ID & Session ID)

  - name: session_id
    type: string
    label: Session ID
    description: The session ID

  - name: user_pseudo_id
    type: string
    label: User Pseudo ID
    description: The user's ID allowing sessions to be connected

  - name: sessions
    type: integer
    expression: sum(sessions)
    label: Sessions
    description: The number of sessions

  - name: engaged_sessions
    type: integer
    label: Engaged sessions
    expression: sum(engaged_sessions)
    description: "The number of sessions meeting one or more of: lasting 10 seconds or longer, having one or more conversion events, or having two or more page or screen views."

  - name: bounces
    type: integer
    expression: sum(bounces)
    label: Bounces
    description: "The number of sessions NOT meeting one or more of: lasting 10 seconds or longer, having one or more conversion events, or having two or more page or screen views."

  - name: engagement_time
    type: number
    aggregates: [avg, sum]
    label: Engagement length
    description: The number of seconds the session lasted

  - name: channel
    type: string
    label: Channel
    description: The channel (e.g. Direct, Email, Organic Search etc.)

  - name: campaign
    type: string
    label: Campaign
    description: The session's associated campaign

  - name: medium
    type: string
    label: Medium
    description: The session's associated medium (e.g. organic, email etc.)

  - name: source
    type: string
    label: Source
    description: The session's associated source

  - name: page_referrer
    type: string
    label: Page referrer
    description: The full referring page URL

  - name: landing_page
    type: string
    label: Landing page
description: The session's landing pagename: ga_pages
label: "[GA] Pages"
caching:
duration: 100000
schedule: 40 * * * *
source:
connection: <your connection key>
query: select * from pages
dependencies:
- name: pages
connection: <your connection key>
query: |-
SELECT page_views.*, session_exit_pages.exits FROM page_views
left join session_exit_pages on session_exit_pages.ga_session_id = page_views.ga_session_id and session_exit_pages.exit_page = page_views.page_full
- name: session_exit_pages
connection: <your connection key>
query: |-
with exit_pages as (
select
concat(user_pseudo_id,(select value.int_value from unnest(event_params) where key = 'ga_session_id')) as ga_session_id,
case when (select value.string_value from unnest(event_params) where event_name = 'page_view' and key = 'page_location') = first_value((select value.string_value from unnest(event_params) where event_name = 'page_view' and key = 'page_location')) over (partition by user_pseudo_id,(select value.int_value from unnest(event_params) where event_name = 'page_view' and key = 'ga_session_id') order by event_timestamp desc) then ( select value.string_value from unnest(event_params) where event_name = 'page_view' and key = 'page_location') else null end as exit_page,
FROM
`analytics_433661858.events_*`
WHERE
_TABLE_SUFFIX BETWEEN FORMAT_DATE('%Y%m%d', DATE_SUB(CURRENT_DATE(), INTERVAL 180 DAY))
AND FORMAT_DATE('%Y%m%d', CURRENT_DATE())
GROUP BY
ga_session_id, event_params, event_name, user_pseudo_id, event_timestamp
)
select *, count(*) as exits from exit_pages
group by ga_session_id, exit_page
- name: page_views
connection: <your connection key>
query: |-
select
parse_date('%Y%m%d', event_date) as event_date,
concat(user_pseudo_id,(select value.int_value from unnest(event_params) where key = 'ga_session_id')) as ga_session_id,
-- device_category
device.category as device_category,
-- page_full
(select value.string_value from unnest(event_params) where event_name = 'page_view' and key = 'page_location') as page_full,
-- landing_page
case when (select value.int_value from unnest(event_params) where event_name = 'page_view' and key = 'entrances') = 1 then (select value.string_value from unnest(event_params) where event_name = 'page_view' and key = 'page_location') end as landing_page,
-- pagepath_level 1
case when split(split((select value.string_value from unnest(event_params) where event_name = 'page_view' and key = 'page_location'),'/')[safe_ordinal(4)],'?')[safe_ordinal(1)] = '' then null else concat('/',split(split((select value.string_value from unnest(event_params) where event_name = 'page_view' and key = 'page_location'),'/')[safe_ordinal(4)],'?')[safe_ordinal(1)]) end as pagepath_level_1,
-- pagepath_level 2
case when split(split((select value.string_value from unnest(event_params) where event_name = 'page_view' and key = 'page_location'),'/')[safe_ordinal(5)],'?')[safe_ordinal(1)] = '' then null else concat('/',split(split((select value.string_value from unnest(event_params) where event_name = 'page_view' and key = 'page_location'),'/')[safe_ordinal(5)],'?')[safe_ordinal(1)]) end as pagepath_level_2,
-- pagepath_level 3
case when split(split((select value.string_value from unnest(event_params) where event_name = 'page_view' and key = 'page_location'),'/')[safe_ordinal(6)],'?')[safe_ordinal(1)] = '' then null else concat('/',split(split((select value.string_value from unnest(event_params) where event_name = 'page_view' and key = 'page_location'),'/')[safe_ordinal(6)],'?')[safe_ordinal(1)]) end as pagepath_level_3,
-- page_title
(select value.string_value from unnest(event_params) where event_name = 'page_view' and key = 'page_title') as page_title,
-- page_views
countif(event_name = 'page_view') as page_views,
-- entrances
count(case when (select value.int_value from unnest(event_params) where event_name = 'page_view' and key = 'entrances') = 1 then concat(user_pseudo_id,(select value.int_value from unnest(event_params) where key = 'ga_session_id')) end) as entrances,
-- unique_pageviews
count(distinct case when event_name = 'page_view' then concat(user_pseudo_id,(select value.int_value from unnest(event_params) where key = 'ga_session_id')) end) as unique_pageviews,
geo.continent as geo_continent,
geo.country as geo_country
from
`analytics_433661858.events_*`
where
_table_suffix between format_date('%Y%m%d', date_sub(current_date(), interval 180 day)) and format_date('%Y%m%d',current_date())
group by
ga_session_id,
event_date,
device_category,
page_full,
landing_page,
page_title,
pagepath_level_1,
pagepath_level_2,
pagepath_level_3,
geo_continent,
geo_country
fields:
- name: event_date
type: date
label: Event date
description: When the event occurred
timeframes: [year_trunc, quarter_trunc, month_trunc, week_trunc, day_trunc, null]
- name: ga_session_id
type: string
primary_key: true
label: User Session ID
description: The composite ID for a given user's session (User Pseudo ID & Session ID)
- name: device_category
type: string
label: Device category
description: The type of device used
- name: page_full
type: string
label: Page (full)
description: The original full page location with any query string
- name: page
type: string
expression: split_part(page_full, '?', 1)
label: Page
description: The page location stripped of query strings
- name: landing_page
type: string
label: Landing page
description: The first page seen in a given user-session
- name: pagepath_level_1
type: string
label: Page path level 1
description: The first page path segment
- name: pagepath_level_2
type: string
label: Page path level 2
description: The second page path segment
- name: pagepath_level_3
type: string
label: Page path level 3
description: The third page path segment
- name: page_title
type: string
label: Title
description: The page title (e.g. in <title></title>)
- name: page_views
type: integer
label: Views
description: The number of page views
- name: entrances
type: integer
label: Entrances
description: The number of sessions that began on this page
- name: exits
type: integer
label: Exits
description: The number of sessions that ended on this page
- name: unique_pageviews
type: integer
label: Unique views
description: The number of unique views within a session
- name: geo_continent
type: string
label: Continent
description: The continent identified through IP address
- name: geo_country
type: string
label: Country
description: The country identified through IP addressname: ga_events
label: "[GA] Events"
caching:
duration: 100000
schedule: 40 * * * *
source:
connection: <your connection key>
query: select * from events
dependencies:
- name: events
connection: <your connection key>
query: |-
select
concat(user_pseudo_id,(select value.int_value from unnest(event_params) where key = 'ga_session_id')) as ga_session_id,
count(distinct concat(user_pseudo_id,(select value.int_value from unnest(event_params) where key = 'ga_session_id'))) as events,
-- event_date (dimension | the date on which the event was logged)
parse_date('%Y%m%d', event_date) as event_date,
-- event_timestamp (dimension | the time (in microseconds, utc) at which
-- the event was logged on the client)
timestamp_micros(event_timestamp) as event_timestamp,
-- event_name (dimension | the name of the event)
event_name,
-- key_event
case when event_name in ('demo_requested', 'demo_scheduled','newsletter_subscribe', 'purchase', 'webinar_signup') then true else false end as is_key_event,
-- event_key (dimension | the event parameter's key | change key to select another parameter)
(select key from unnest(event_params) where key = 'page_location') as event_key,
-- event_string_value (dimension | the string value of the event parameter | change key to select another parameter)
(select value.string_value from unnest(event_params) where key = 'page_location') as event_string_value,
-- event_int_value (mdimension | the integer value of the event parameter | change key to select another parameter)
(select value.int_value from unnest(event_params) where key = 'ga_session_id') as event_int_value,
-- event_float_value (dimension | the float value of the event parameter | change key to select another parameter)
(select value.float_value from unnest(event_params) where key = 'page_location') as event_float_value,
-- event_double_value (dimension | the double value of the event parameter | change key to select another parameter)
(select value.double_value from unnest(event_params) where key = 'page_location') as event_double_value
from
`analytics_433661858.events_*`
where
_table_suffix between format_date('%Y%m%d', date_sub(current_date(), interval 180 day)) and format_date('%Y%m%d',current_date())
group by
ga_session_id,
event_date,
event_timestamp,
event_name,
event_params
fields:
- name: ga_session_id
type: string
primary_key: true
label: Session ID
description: The unique key formed of Google's "user pseudo id" and session id
- name: event_date
type: date
label: Event date
description: The date of the event
timeframes: [year_trunc, quarter_trunc, month_trunc, week_trunc, day_trunc, null]
- name: event_timestamp
type: date
label: Event timestamp
description: The full server timestamp of the event
- name: event_name
type: string
- name: is_key_event
type: boolean
label: Is key event?
description: Whether the event matches the (hard-coded) list of key events
- name: event_key
type: string
label: Event key
- name: event_string_value
type: string
label: Event string value
group: Event payload
- name: event_int_value
type: integer
label: Event int value
group: Event payload
- name: event_float_value
type: number
label: Event float value
group: Event payload
- name: event_double_value
type: number
label: Event double value
group: Event payload
- name: events
type: integer
label: Events
description: The number of eventsname: ga4
label: "Google Analytics"
from: ga_sessions
join:
- view: ga_pages
constraint: ga_pages.ga_session_id = ga_sessions.ga_session_id
relationship: one_to_one
- view: ga_events
constraint: ga_events.ga_session_id = ga_sessions.ga_session_id
relationship: one_to_manyStep 4: Extending Beyond Standard GA4
The real power comes from going beyond what GA4 can do:
1. Custom Event Definitions
Add your own business-specific events to the key_events view:
-- Extended key_events with custom business logic
SELECT *,
  CASE
    WHEN event_name = 'page_view'
      AND page_title LIKE '%pricing%' THEN 'pricing_page_view'
    WHEN event_name = 'page_view'
      AND page_title LIKE '%contact%' THEN 'contact_page_view'
    WHEN event_name = 'click'
      AND (SELECT value.string_value FROM UNNEST(event_params) WHERE key = 'link_url') LIKE '%/demo%'
      THEN 'demo_request'
  END as custom_event_type
FROM key_events
2. Blending with Other Data Sources
The real magic happens when you join GA4 with other data:
SELECT
  s.session_id,
  s.user_pseudo_id,
  s.source,
  s.medium,
  o.opportunity_id,
  o.amount,
  o.close_date
FROM sessions s
LEFT JOIN crm_opportunities o
  ON s.user_pseudo_id = o.user_id  -- Requires emitting user IDs from your site
WHERE o.created_date >= s.session_date
This lets you answer questions like: "What's the average deal size for leads from organic search vs. paid ads?"
3. Custom Channel Groupings
Override GA4's default channel groupings with your own logic:
-- Custom channel grouping metric
CASE
  WHEN source = 'google' AND medium = 'cpc' THEN 'Paid Search'
  WHEN source IN ('linkedin', 'twitter', 'facebook') AND medium = 'social' THEN 'Organic Social'
  WHEN source IN ('linkedin', 'twitter', 'facebook') AND medium LIKE '%paid%' THEN 'Paid Social'
  WHEN medium = 'email' AND campaign LIKE '%newsletter%' THEN 'Newsletter'
  WHEN medium = 'email' THEN 'Email Marketing'
  WHEN source = 'partners.example.com' THEN 'Partner Referral'
  WHEN medium = 'organic' THEN 'Organic Search'
  WHEN medium = 'referral' THEN 'Referral'
  WHEN source = '(direct)' THEN 'Direct'
  ELSE 'Other'
END as marketing_channel
Turning website data into business intelligence
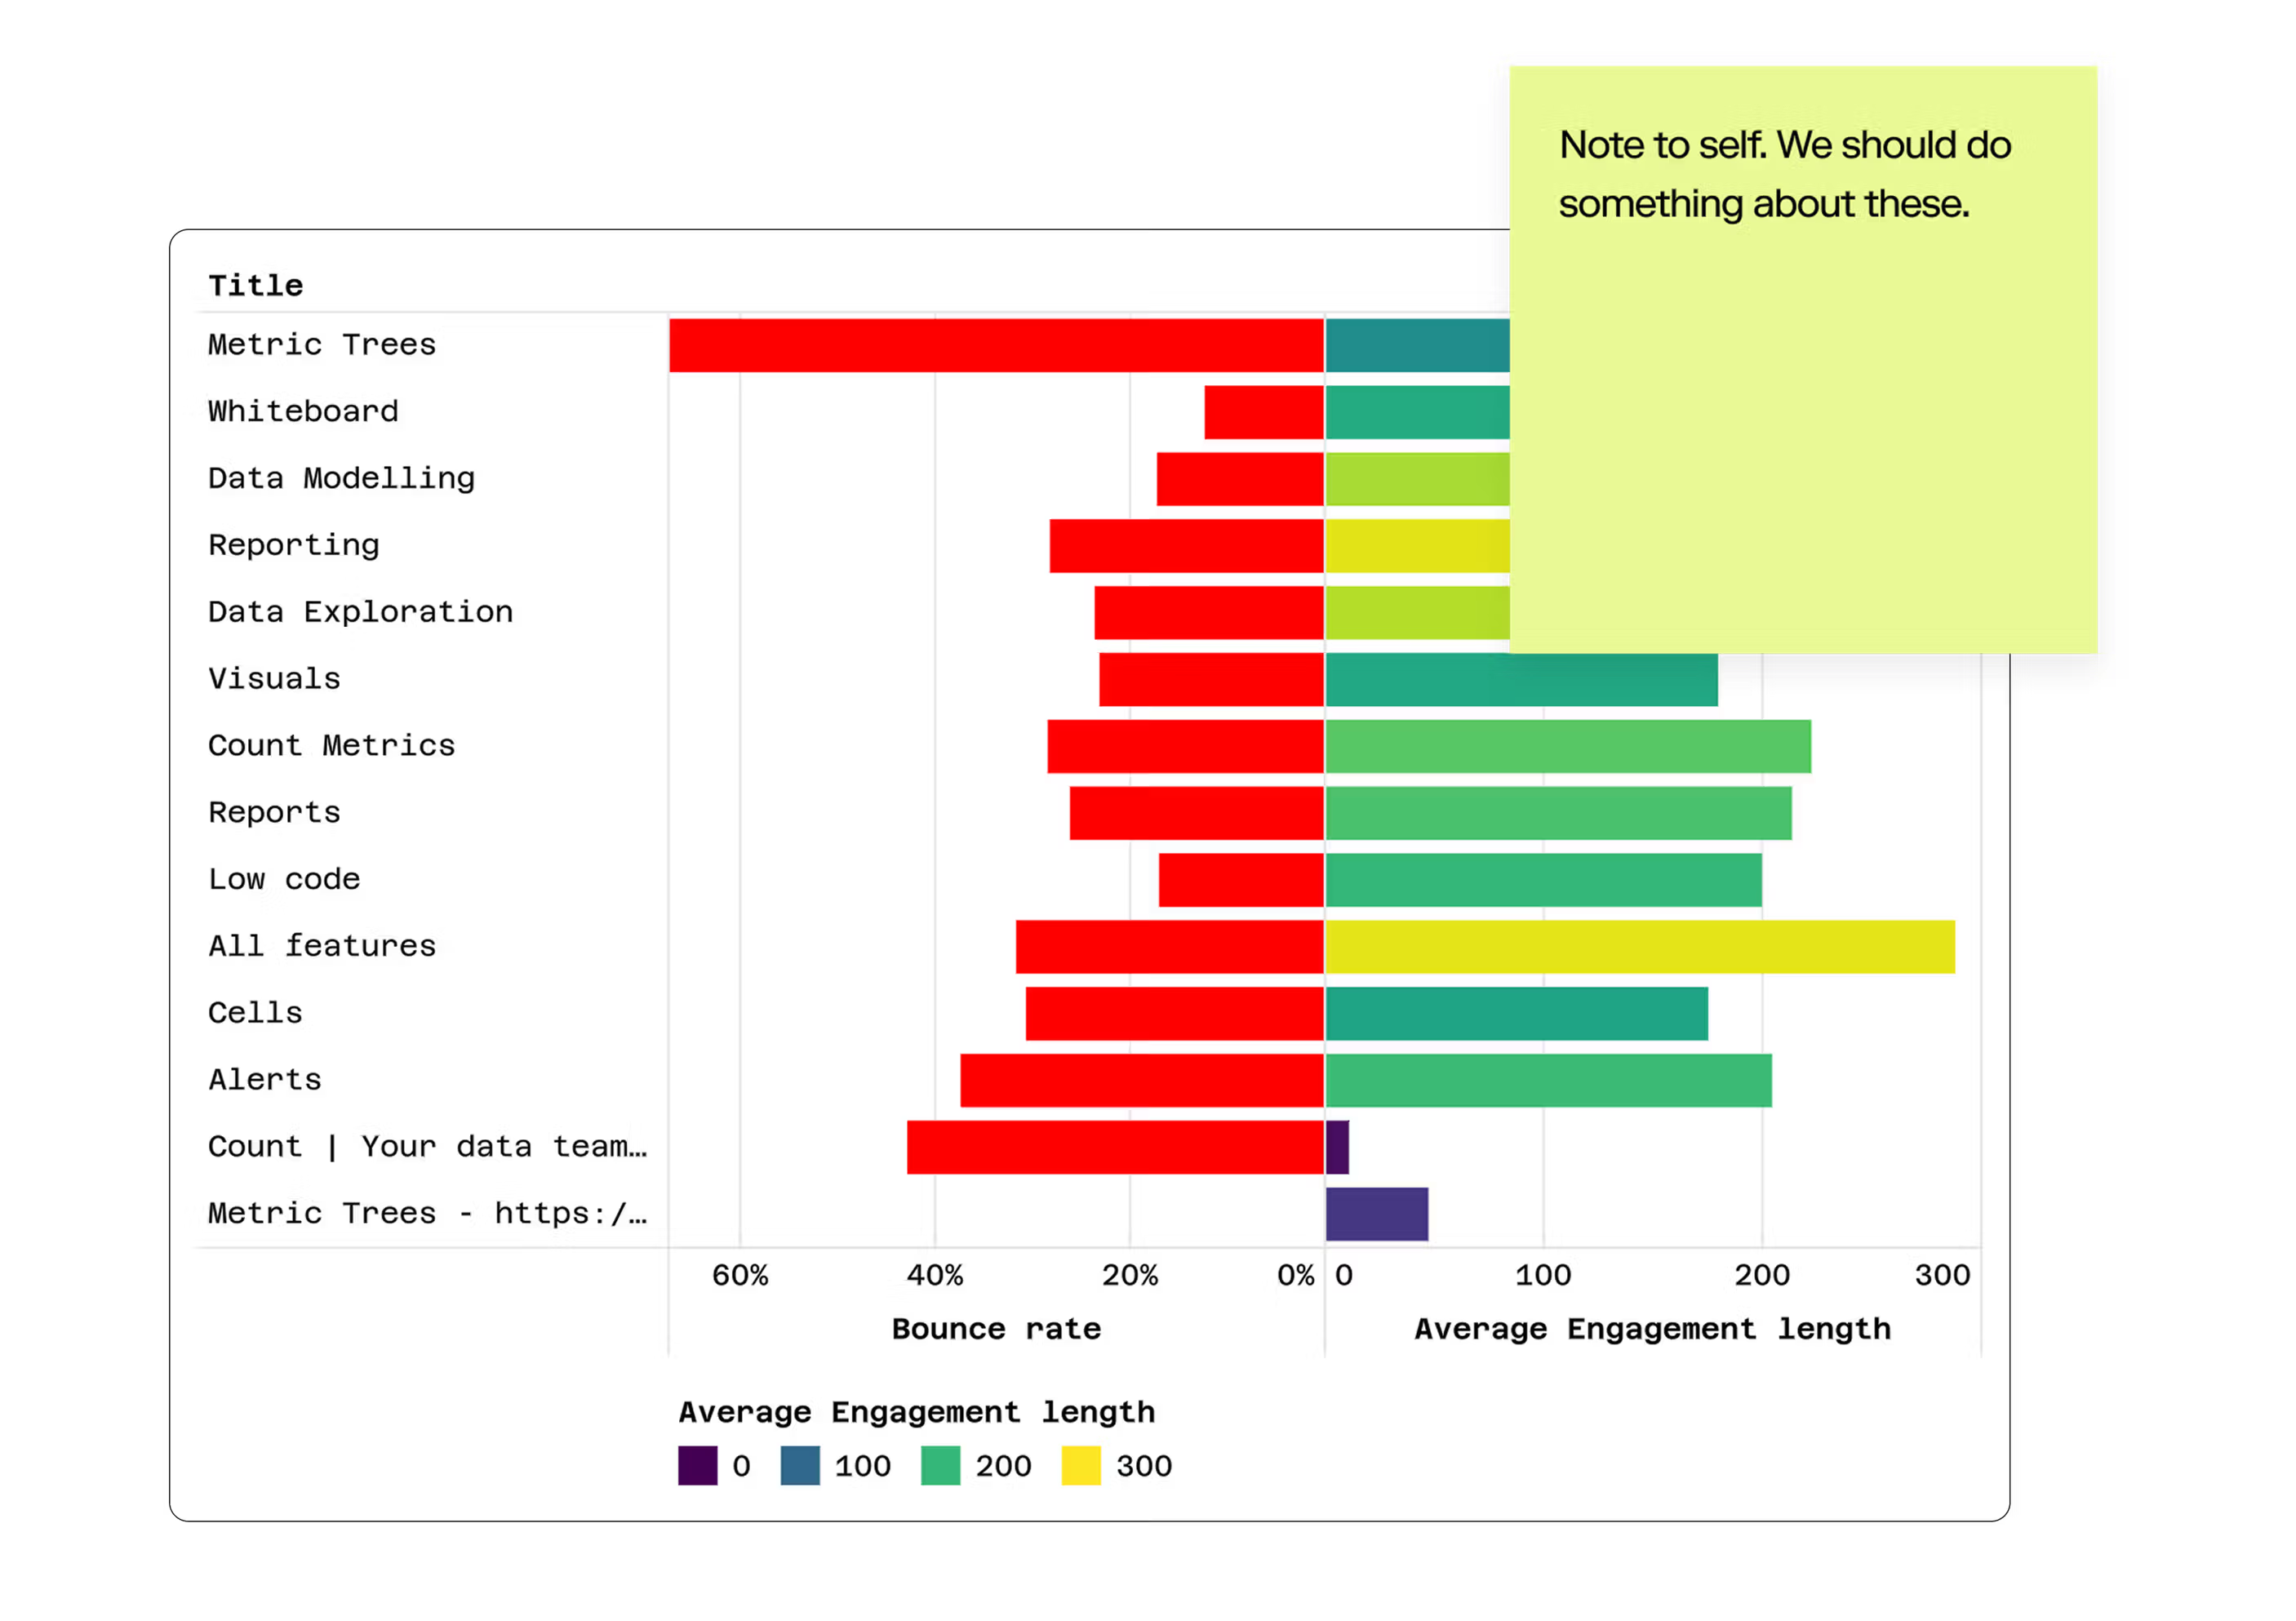
A powerful first use-case for GA4 data in Count is to go beyond the funnels possible otherwise and present it in customised metric trees that turn events and page_views into metrics your business can understand.
Here is a simple example where Google Analytics data is used to break down lead activity by intent: GA4 Website Metric tree.
Best Practices
1. Start with a Limited Date Range
GA4 data can be massive. When setting up your initial views and metrics, start with 90 days of data. Once you've validated everything works, expand to your full dataset.
2. Use Incremental Models
If you're using dbt or similar transformation tools, set up incremental models that only process new data each day rather than reprocessing the entire dataset.
3. Document Your Metrics
Use Count's metric descriptions to document exactly how each metric is calculated. This prevents confusion when "conversions" means different things to different teams.
4. Create a Marketing Catalog
Set up a dedicated Count catalog for marketing metrics. This gives marketing teams a curated set of metrics and dimensions without overwhelming them with every possible field from the raw data.
5. Establish Naming Conventions
Be consistent in how you name things:
- Use
snake_casefor SQL field names - Use Title Case for metric names in Count
- Prefix custom events with your domain (e.g.,
custom_demo_request)
Common Challenges and Solutions
Challenge: GA4 events table is huge and queries are slow.
Solution: Create materialized views or summary tables for common aggregations (daily session counts, page views by date, etc.). Query these pre-aggregated tables for dashboards, and only query the raw events table for deep-dive analysis.
Challenge: Users have multiple sessions with different sources/mediums.
Solution: Define your attribution logic explicitly in your metrics. Create separate metrics for first-touch, last-touch, and linear attribution so stakeholders can choose the model that makes sense for their question.
Challenge: GA4's nested event_params structure is hard to work with.
Solution: Flatten the most commonly used event parameters into columns in your views. For example, always unnest page_location, page_title, and other frequently used parameters so marketers don't need to understand the nested structure.
Challenge: Data doesn't match between Count and GA4 interface.
Solution: GA4 uses different sampling and aggregation logic than direct SQL queries. Small differences (1-2%) are normal. For larger discrepancies, check: timezone settings, date range boundaries, and whether GA4 is filtering out bot traffic that your warehouse queries include.
Next Steps
Once you have GA4 data flowing into Count, consider:
- Add marketing spend data from ad platforms to calculate true ROAS
- Connect CRM data to track the full funnel from session to closed deal
- Integrate product usage data to understand how web behavior predicts product engagement
- Set up customer journey analysis by tracking users across multiple sessions and touchpoints
The beauty of Count is that all of this analysis happens in one place, using the same semantic layer, with the flexibility to explore freely rather than being constrained by pre-built reports.
Conclusion
Bringing GA4 data into Count isn't just about replicating what you can already see in Google Analytics—it's about unlocking analysis that's impossible in GA4's interface. By modeling the data with Count Metrics, you give marketing teams the freedom to explore, combined with the guardrails of well-defined metrics. And by blending web analytics with other business data, you can finally answer questions like "which marketing channels drive the highest-value customers?" or "what's the ROI of our content marketing?"
The initial setup requires some technical work, but once it's done, marketers get a self-service analytics environment that's more powerful, flexible, and collaborative than anything possible in GA4 alone.