Lessons from Intruder: 7 Proven Ways to Make OKRs Actually Work
If you’ve ever tried running OKRs, you know the story: everyone’s excited at kickoff, objectives get written, key results are set... and three months later, you’re wondering why nothing meaningful has changed.
You’re not alone.
In a pre-webinar poll, 82% of attendees said they already use OKRs. Butnot a single onerated themselves above 3/5 in terms of doing them well. The gap between intention and impact is real.
That’s why we sat down with the team atIntruderin a recent webinar to hear how they rethought OKRs using data to drive real alignment and growth.
Here, we cover seven key points raised on the webinar that you should keep in mind when trying to build a system like Intruder’s to make OKRs more effective.
1. Don’t confuse activity with impact
Intruder’s early OKR process looked fine on paper: projects were delivered, key results turned green... but top-level business goals didn’t budge.
“We’d see all these projects complete, success metrics ticked off, but the objective—like improving retention—didn’t actually move”
The team was busy, but they often found themselves celebrating outputs rather than outcomes. Important company metrics like retention and revenue growth stayed flat, creating frustration that all the effort wasn’t translating into meaningful progress.
It became clear that the system rewarded activity for activity’s sake instead of real impact.
Hitting OKR checkboxes doesn’t matter if the business needle stays still.
2. Tool sprawl kills clarity
Like many teams, Intruder had OKRs in one tool (Lattice) and business metrics in another. That disconnect meant manual updates, wasted time, and leadership meetings spent debating whose numbers were “right.”
“There was a burden on people to update things manually, which meant results were out of date and disconnected from how we actually measured success.”
This misalignment didn’t just cause inefficiency—it actively undermined trust in the process.
Different teams would show up to leadership meetings with conflicting versions of the truth, slowing down decisions and creating frustration. Instead of focusing on solving problems, leaders were stuck reconciling numbers and debating which dataset to believe.
🔥Lesson: If your OKRs live separately from your data, alignment will always be fragile.
3. Build your OKRsyour data workflows
The turning point came when Intruder’s leadership asked:“Can’t we just do this in Count?”
By wiring live data from their warehouse directly into Count canvases, OKRs became measurable, transparent, and dynamic.
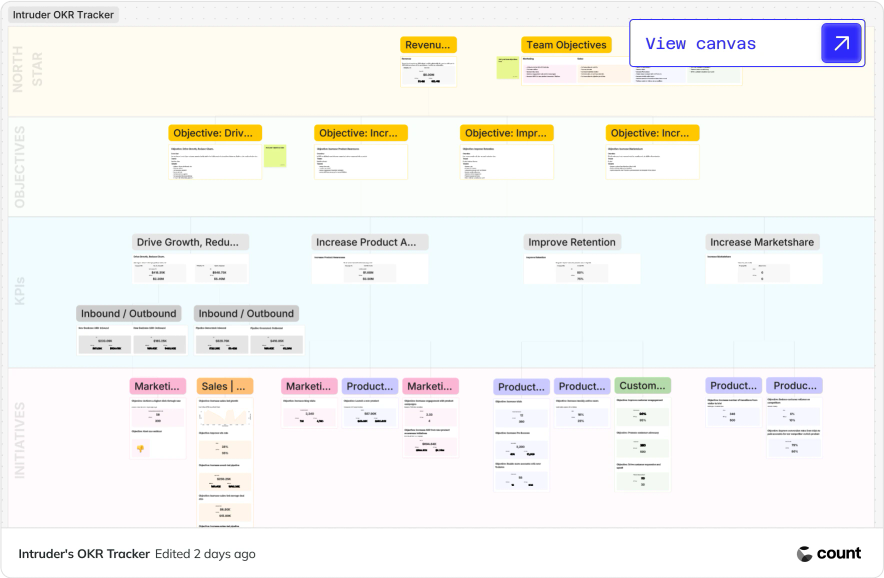
Now, when revenue is their North Star, they can drill into churn, expansion, inbound, and outbound performance—all automatically updating and color-coded against targets.
🙌The result: No more manual reporting. OKRs are living documents tied to live data.
📊FULL CANVAS EXAMPLE
Explore Intruder's OKR canvas in our Gallery then replicate in your own Count Workspace.

4. Set objectives that move the needle (and review with rhythm)
Intruder used to set OKRs every quarter, which often felt like a rushed exercise. Now, they’ve shifted to setting four clear company-wide objectives for the year.
This means they're simple enough to manage, but broad enough for different teams to contribute in meaningful ways. Market share growth might fall under marketing, for example, but it’s equally tied to how product expands into new markets.
As Andy explained, the real change came from linking these objectives directly to live KPIs. Instead of static lists, every objective cascades into measurable results that update automatically from the data warehouse.
That means any team member can trace progress from the North Star metric down to the individual drivers and see exactly how their work contributes.
“We put it up on screen and work through it. If we’re missing target, we talk about why and what we’ll do next,” explained David Koke, Head of Marketing.
💡Key takeaway: Objectives only work if they’re stable enough to guide the company, few enough to focus teams, and measurable enough that everyone can track progress in real-time.
5. Make OKRs the heartbeat of leadership meetings
For Intruder, the OKR canvas isn’t just a report—it’s the agenda for every senior leadership meeting.
The team starts at the very top with the North Star and works down through objectives and key results. Each leader speaks to the metrics they own, sharing context and commentary, while the group discusses what’s working, where targets are being missed, and what to do next.
As David explained, “This Canvas has essentially become our agenda for that meeting. We put it up on screen and we’re talking about it for an hour or two hours, however long it takes.”
This rhythm prevents silos and reduces friction between teams: sales, marketing, and product all see the same live numbers and align on the same goals. What used to feel clunky and disjointed has become open, continuous communication around what matters most.
💡Key takeaway: Let your OKR canvas set the agenda. It keeps leadership conversations focused, transparent, collaborative, and action-oriented.
6. Extend OKRs into department metric trees
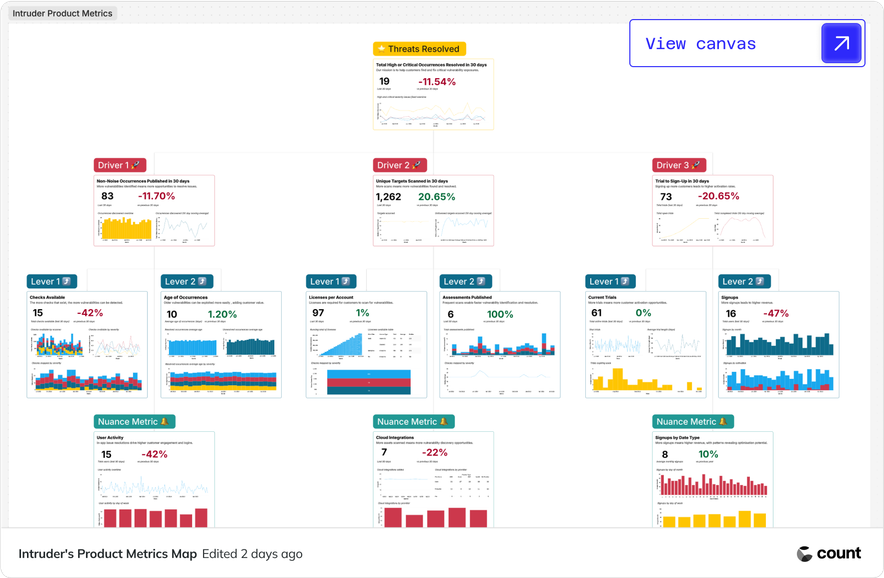
The company-wide OKR board links down into department-level “metric trees.” For example, in Product, their North Star is customers finding and fixing critical vulnerabilities.
Drivers like “number of vulnerability checks” or “cloud integrations added” ladder up directly to retention and ARR goals.
This diagnostic view means teams can spot issues early and tie tactical work back to strategic OKRs.
📊FULL CANVAS EXAMPLE
Explore Intruder's product metrics canvas in our Gallery then replicate in your own Count Workspace.

Marketing has its own version too, with a canvas that traces the funnel from trials through to revenue and overlays commentary from team members. That consistency across departments ensures everyone is measuring progress in the same way and feeding back into the bigger picture.
🚀Pro tip: Usemetric treesto connect operational levers to business outcomes.
7. Empower non-technical teams with a semantic layer
All of this only works if non-technical stakeholders can actually use the system themselves. For Intruder, that meant building a semantic layer on top of the warehouse withCount Metrics.
The data team defined the foundations, but then made them accessible through a drag-and-drop interface so teams like Marketing could answer their own questions without waiting in a request queue.
As Aadam put it, the metric layer “lets people drill down and answer questions ad hoc in their own time and without the need for SQL.”
For David as the marketing leader, that meant being able to unify CRM and product usage data, then quickly build the funnel view his team needed: trials, meetings, opportunities, and revenue. All without pulling in the data team each time and having to wait for it all to be built for him.
💡Key takeaway: A semantic layer turns OKRs into a company-wide practice, not just a data team project.
Get started building your own OKR system like Intruder's
Intruder’s journey shows what’s possible when OKRs stop being a reporting exercise and start beingdata-driven alignment tools.
The big shift? Moving from disconnected goals and dashboards… to a single living canvas where metrics, objectives, and team conversations all meet.
Want to dive deeper?Watch the full webinarto see how Intruder built their OKR system in Count—and then try it for yourself. We’ve built areplica of their OKR canvasthat you can explore and copy straight into your own Count workspace.
Use it as a starting point, adapt it to your business, and get your team aligned today.