An Introduction to Metric Trees
Updated: October 24, 2025
Metric trees are having a moment, which has many of us asking what they’re really about. Last week we hosted a coffee in our More Than Numbers Slack Community to give people a chance to ask their burning Metric Tree questions and learn from one another.
That discussion inspires today’s article, as I imagine the topics covered are top of mind for many people beyond that discussion.
So let’s dive in.
What is a metric tree?
“A metric tree is an analytical model that takes metrics and their weighted relationships to represent the flow of inputs into a business and how they are transformed into outputs.” - Abhi Sivasailam [1]

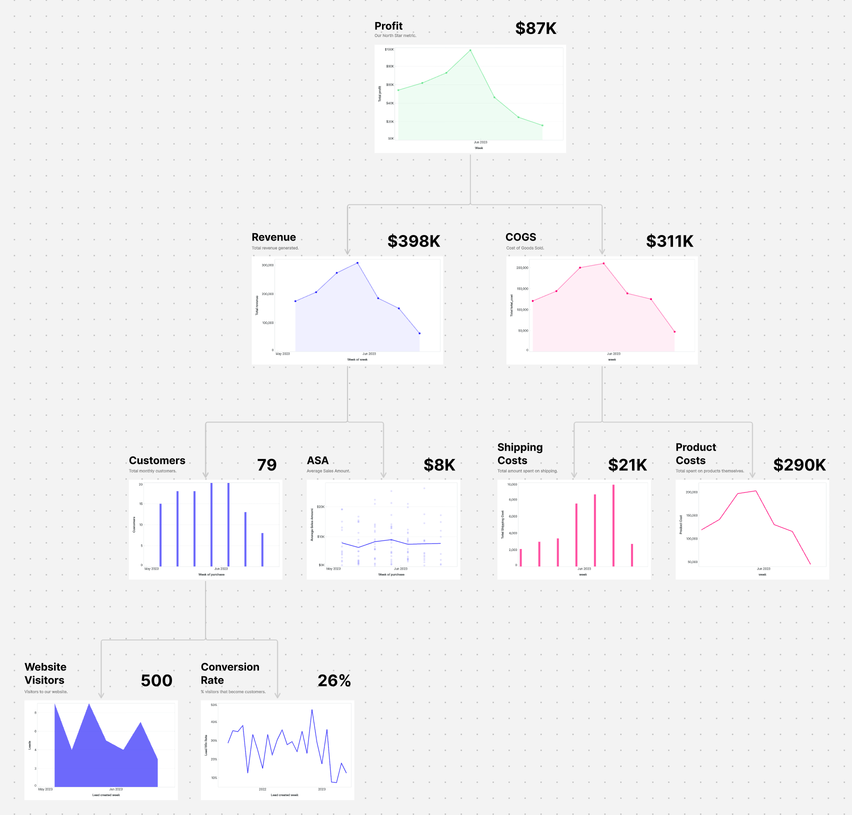
In a metric tree, each node represents a metric. Each metric contains a business definition, and a data definition (usually as a formula). You can include other info like the units, timeframe, and source systems as well.
Each edge represents a driver or an influence. For example, new sign-ups can be decomposed into New Traffic, and Conversion Rate, and Lead Acceptance Rate is influenced by Lead score.
A key component of metric trees is how they build in complexity, decomposing a metric into lower and lower levels of metrics. In a webinar, the Count team broke down how to tackle this process before you start working with data:
Metric tree vs. KPI tree
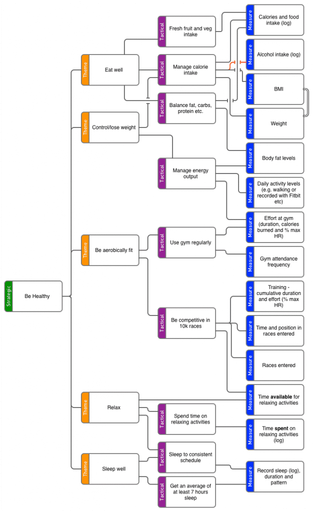
KPI trees were invented by Bernie Smith in 2011 [2]. Like metric trees, KPI trees decompose a company’s KPIs into its component goals. They also serve many of the same purposes - to align the business around a common strategy and understanding of the business.

The main difference between Metric trees and KPI trees comes down to the difference between metrics and KPIs. The latter is a goal or ambition, while metrics are more operational.
When you want to track numbers use metric trees. When you want to track strategy and goals, use KPI trees.
Metric tree vs. Issue trees
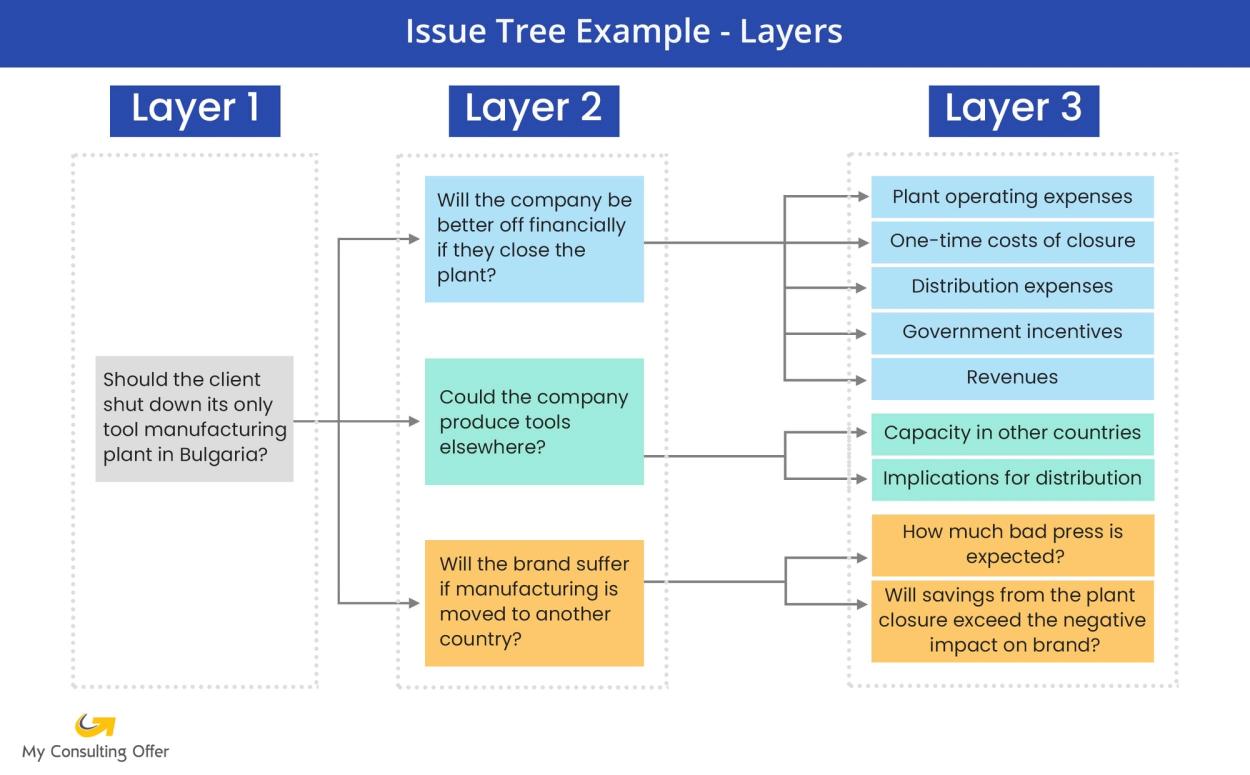
Issue trees, sometimes called decision trees, help think through and communicate complex problems. These trees use hierarchy to decompose a question, problem, or decision into its component parts [3].

Issue trees are very powerful when used in an analytical context, however they differ from Metric trees in that they focus on an individual problem or decision.
What’s the point of a metric tree? Why are they used?
Metric Trees as an output type are used instead of traditional KPI dashboards in which numbers are presented in a grid.
There are two reasons metric trees are so effective:
- The visual structure
- The process by which it is created
The structure
By presenting metrics in a hierarchy, you achieve the following:
- easy identification of key metrics and the drivers of those metrics
- easy identification of and alignment on the biggest problems in those trees
- a better understanding of how each department impacts the wider company targets
The process
It is nearly impossible for a data team to build a metric tree in isolation. There is too much context required from the business (e.g. metric definitions, the best way to decompose a metric while ensuring each step is meaningful and actionable).
Therefore, by taking a collaborative and iterative approach to building a metric tree, you are also able to achieve:
- a common understanding of key metric definitions (often these definitions are created through this process)
- an improved relationship between data and business teams
Where are metric trees being used?
No specific industry or department is better or worse positioned to use metric trees. We have worked with teams who use it to create and manage the company’s North Star metrics where it is the de-facto way all parts of the business understand how the company is doing, and what the biggest problems are.
It is also used on a smaller scale within individual departments, helping to break down a broad goal of ‘generating more qualified leads’ into manageable and actionable targets.
A final pattern we’ve noticed is that teams most familiar with trees and flows tend to pick up metric trees quickly and more fervently.
Are there alternatives to a metric tree?
KPI trees as mentioned above, are another way to look at the business in a hierarchy, but don’t contain metrics or any calculations.
Issue and decision trees are valuable ways to structure and communicate a specific problem or decision but don't cover the breadth of a metric tree.
There are other visual techniques to help you understand your business in new ways like process flows, or even more advanced frameworks often seen in systems engineering, however they are less action-orientated.
And of course, there are typical dashboards, that show the metrics but leave out the crucial hierarchy, and context required to make those numbers actionable.
Metric Tree Concerns
Do they scale?
This is the top concern for data leaders who are bought into the value of metric trees but are wondering about the costs of building them. It’s easy to look at this process and see a lot of manual work, a lot of back and forth with business users, and potentially a lot of moving parts, none of which scales very well.
Before diving into the question, it’s important to ask what should and shouldn’t scale when thinking of metric trees.
1. Don’t try to scale conversations
Much of the value of metric trees comes from the process of building them. Trying to expedite that or, skip that step can lead to a tree that doesn’t get adopted or used. Instead of trying to avoid working with stakeholders when building a tree, think of ways to make those conversations more productive.
Use (Standard Operating Metrics & Analytics) [4] to get ideas - Abhi Sivialasilam has painstakingly created a standardized set of metric trees for a variety of businesses. These trees are very helpful for getting ideas of how to decompose metrics, or even for metrics themselves. Don’t be afraid to differ from those standards though, when it makes sense for your business.
2. Scaling exploration of trees
Once you have your metrics defined, you can define those metrics in a semantic layer like LookML, or Cube. This makes those metrics explorable by the rest of the business while making sure they are standardized.
3. Things will change, so don't spend too much time scaling
In general, the goals and metrics a company cares about do shift over time (some every quarter, some every few years), so a piece of advice I’ve heard is not to get too concerned about making this tree last forever. The important part is that it is useful today to help identify what really needs to be done.
How to get the business bought into building a metric tree?
Getting buy-in is the second most common concern we hear. The advice I’ve come across is to remember that most business leaders are desperate for more clarity on how their business works and what the biggest problems are. Metric trees are excellent vehicles for both of those.
Showing how building out this metric tree can help them make sense of the many conflicting priorities in their minds and on their teams is a great strategy for getting business buy-in.
The exact way that is done will vary by business and across cultures. We hope to share some examples of various approaches people have made, so stay tuned for that.
How to build metric trees?
Once you’re finally ready to dive into the metric tree, how do you start building them?
Abhi and Trevor’s advice is the best I’ve seen here, and has three steps[1]:
- Defining the North Star metric
- Decompose into components
- Identifying influences
There are best practices already emerging here that we’ll share soon as well.
What tools are people using to build metric trees?
Would it be a conversation with data folks if tooling didn’t come up? Here are the most common ways people are building metric trees:
Whiteboarding tools
Whiteboarding tools like Miro offer a collaborative and flexible space to start mapping out your trees. Your stakeholders will likely already be familiar with them so you will facilitate much more collaboration with this approach than by using a data tool.
Traditional BI tools
When adding data to your trees, youcantechnically build trees in tools like Tableau and Looker, but it comes at a cost. These tools aren’t built for these types of diagrams so it’s very tricky and custom to do it, and it doesn’t scale well to build out another tree for a new team. The lack of flexibility makes exploration challenging as well.
Count

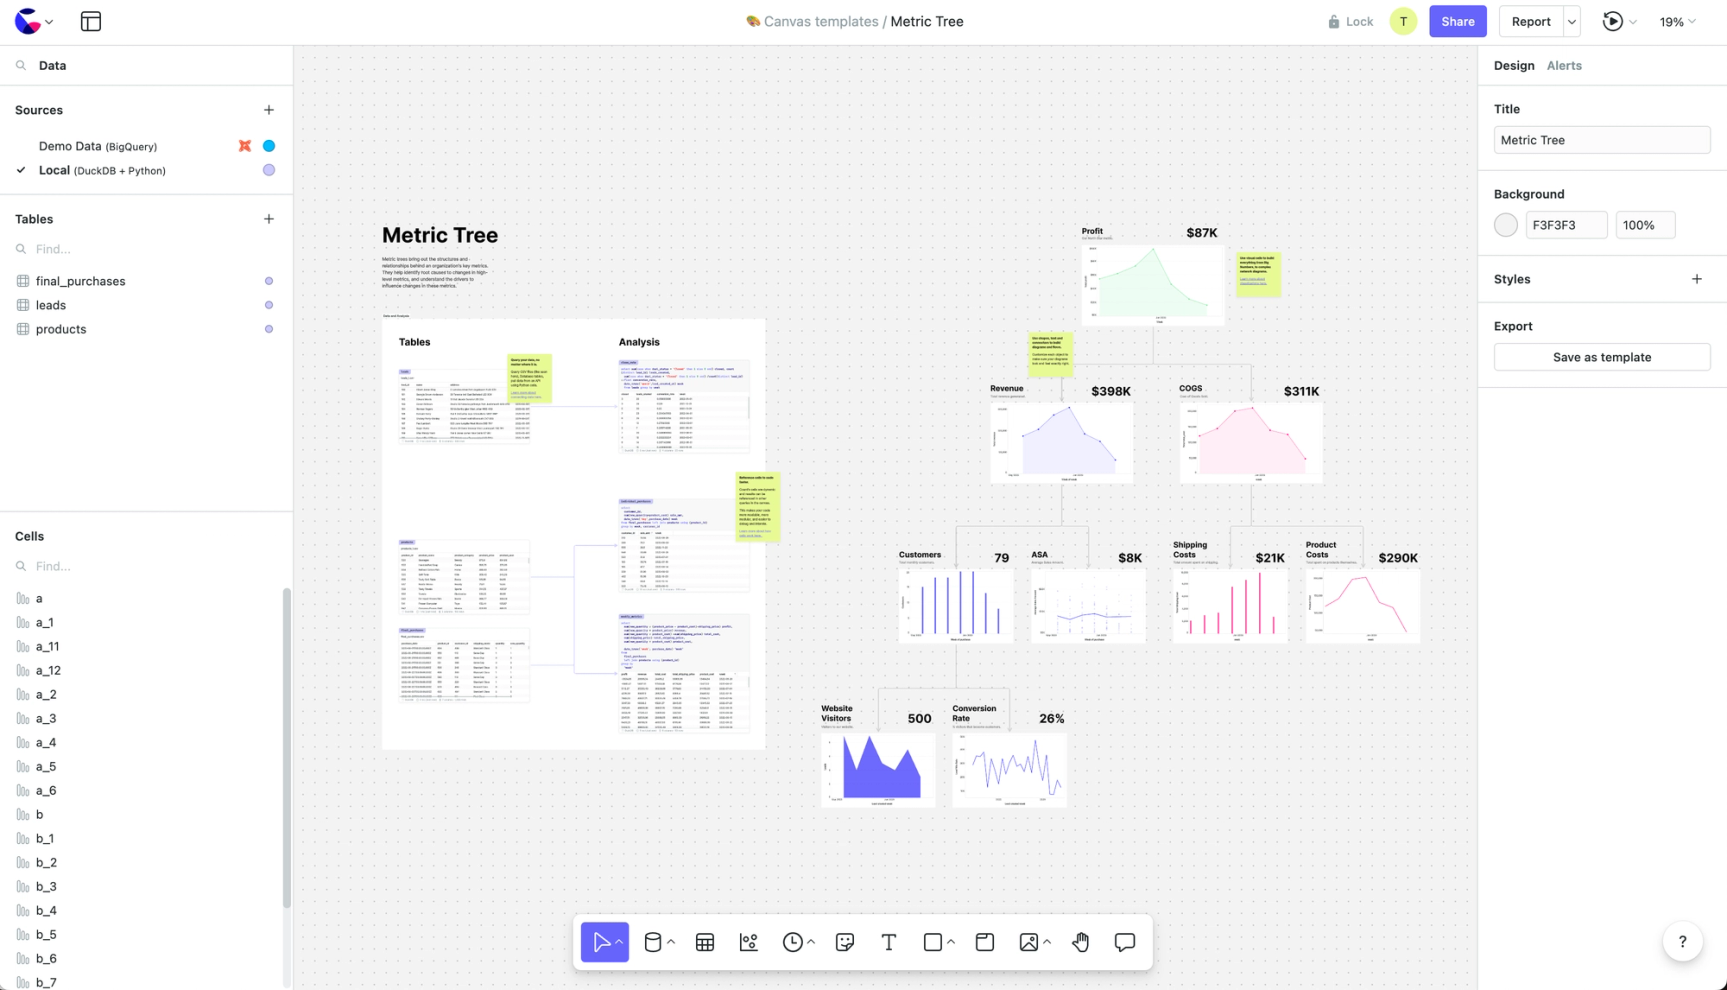
Count is a combination of a whiteboarding tool, BI tool, and SQL IDE, making it ideal for building metric trees, and indeed, metric trees are one of the most popular use cases for our customers. You can use the whiteboard to map out your tree with stakeholders, agree to definitions, and then start adding data from your database or tool of choice. You have the ultimate flexibility to build any kind of tree you want, and when it’s live you still have all the flexibility to explore those trees.
Learn morehere.
Where to learn more about Metric Trees
- The following people regularly post valuable, and practical advice on Metric Trees on LinkedIn:
Any others you know about that aren’t listed, please let me know!
Resources
[1] Fox, T. and Sivasailam, A. (2024)Introducing metric trees,Introducing Metric Trees | Metric Tree Guide | Levers Labs. Available at:https://www.leverslabs.com/article/introducing-metric-trees.
[2]Ultimate KPI Tree Guide: How to build a killer KPI tree [2024](no date)Made to Measure KPIs. Available at:https://madetomeasurekpis.com/building-kpi-tree/.
[3] Kenney, Liz. (2024)Issue Tree: The Complete Guide with examples 2024,My Consulting Offer. Available at:https://www.myconsultingoffer.org/case-study-interview-prep/issue-tree/(Accessed: 07 May 2024).
[4]SOMA: B2B SaaS. Levers Labs. Available at:https://github.com/Levers-Labs/SOMA-B2B-SaaS