Notebooks have sped up time to chart. Count speeds up time to decision.
Notebooks like Jupyter and Hex give analysts powerful tools to explore data. They’re great for writing queries, running models, and producing outputs.
But when analysis needs to be shared, discussed, and turned into a decision, notebooks break down and Count begins.
Notebooks: “Give analysts the tools to do their technical work”
Count: “Turn that work into trusted decisions, by bringing the business in”
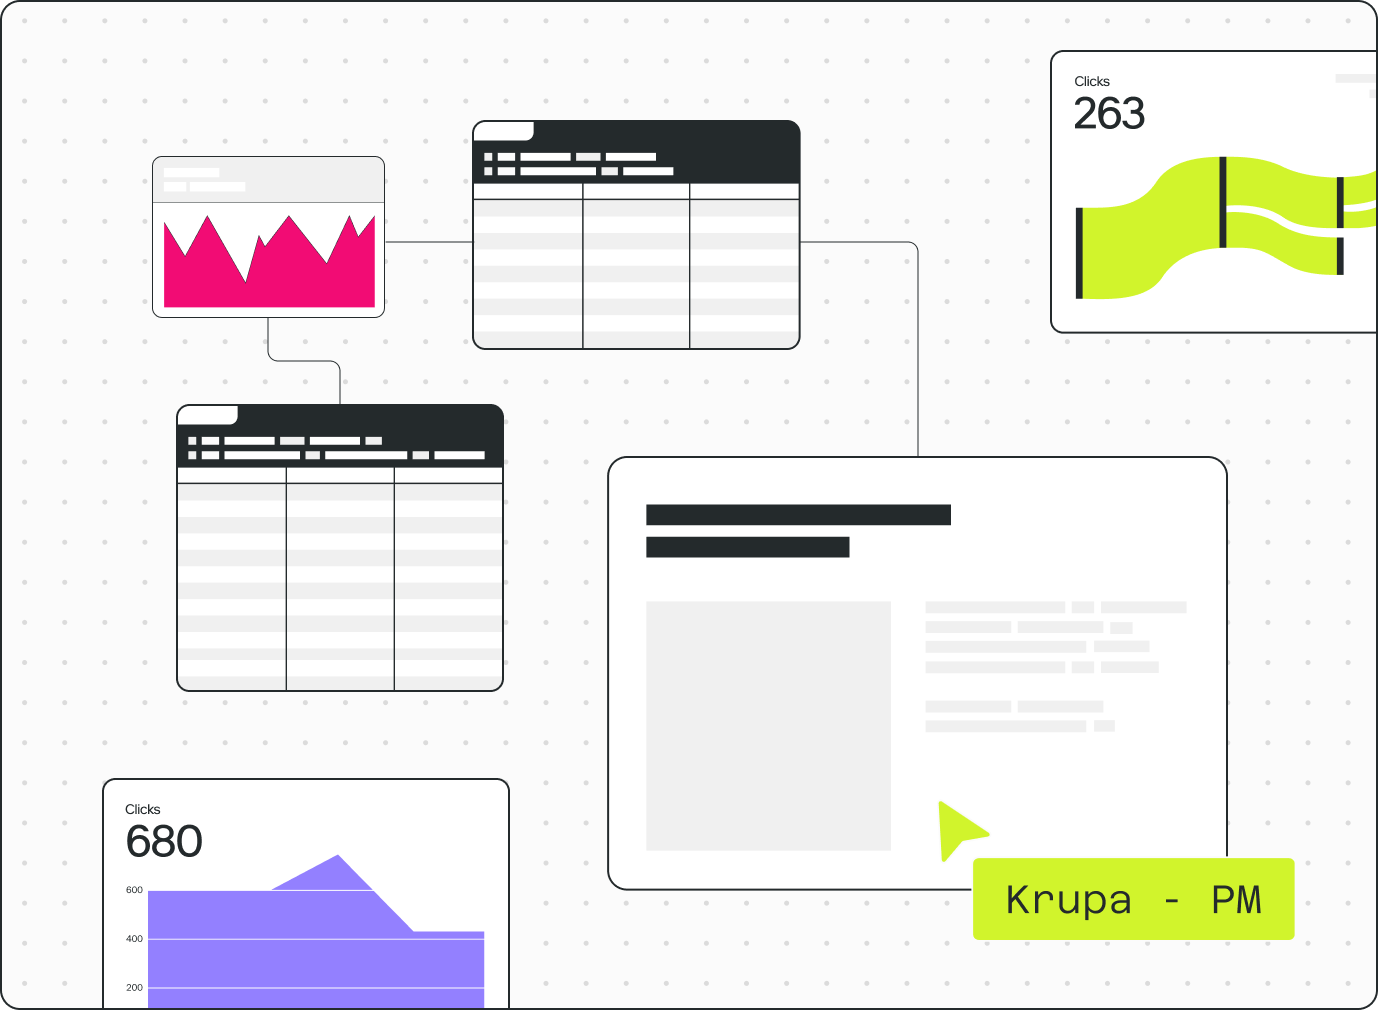
Notebooks give you SQL, Python, and visualisations in a linear sequence of cells.
Count gives you all of that on an infinite canvas so you can branch into hypotheses, fork assumptions, lay out your thinking visually, and backtrack without losing context.
Analytics isn't linear. Your workspace shouldn't be either.
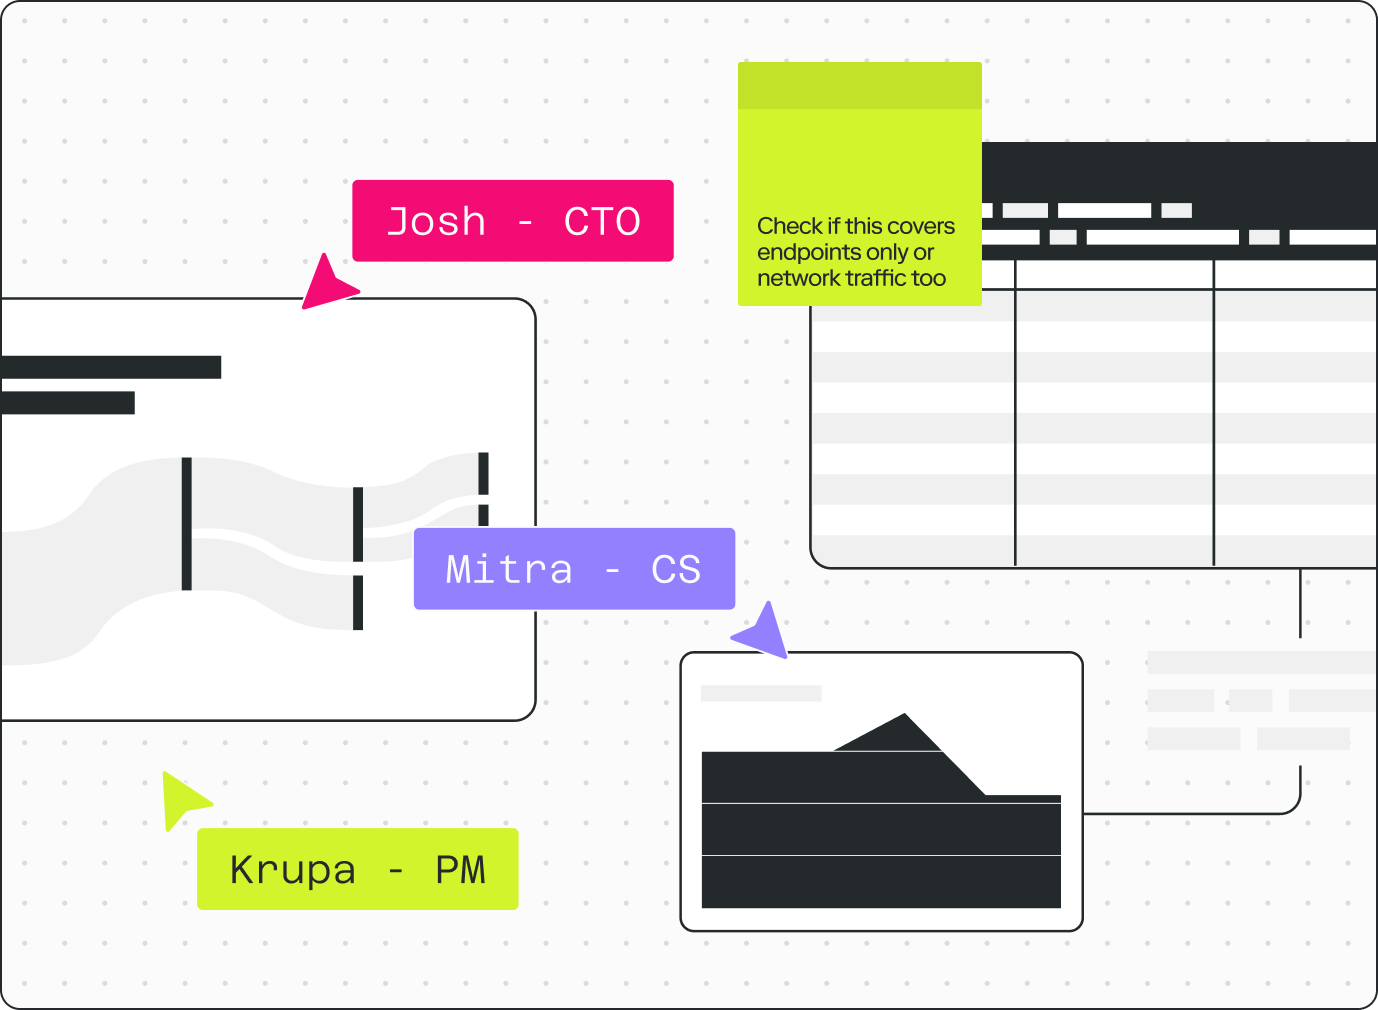
Notebooks work well for data practitioners, but break down when others need to get involved.
Sharing is hard. Context is lost. Collaboration happens outside the tool.
Count lets data teams work iteratively with business stakeholders in the same space.
Stakeholders follow the logic, challenge the numbers, and contribute context the analyst doesn't have. Projects move faster and the outcome is trusted by default.
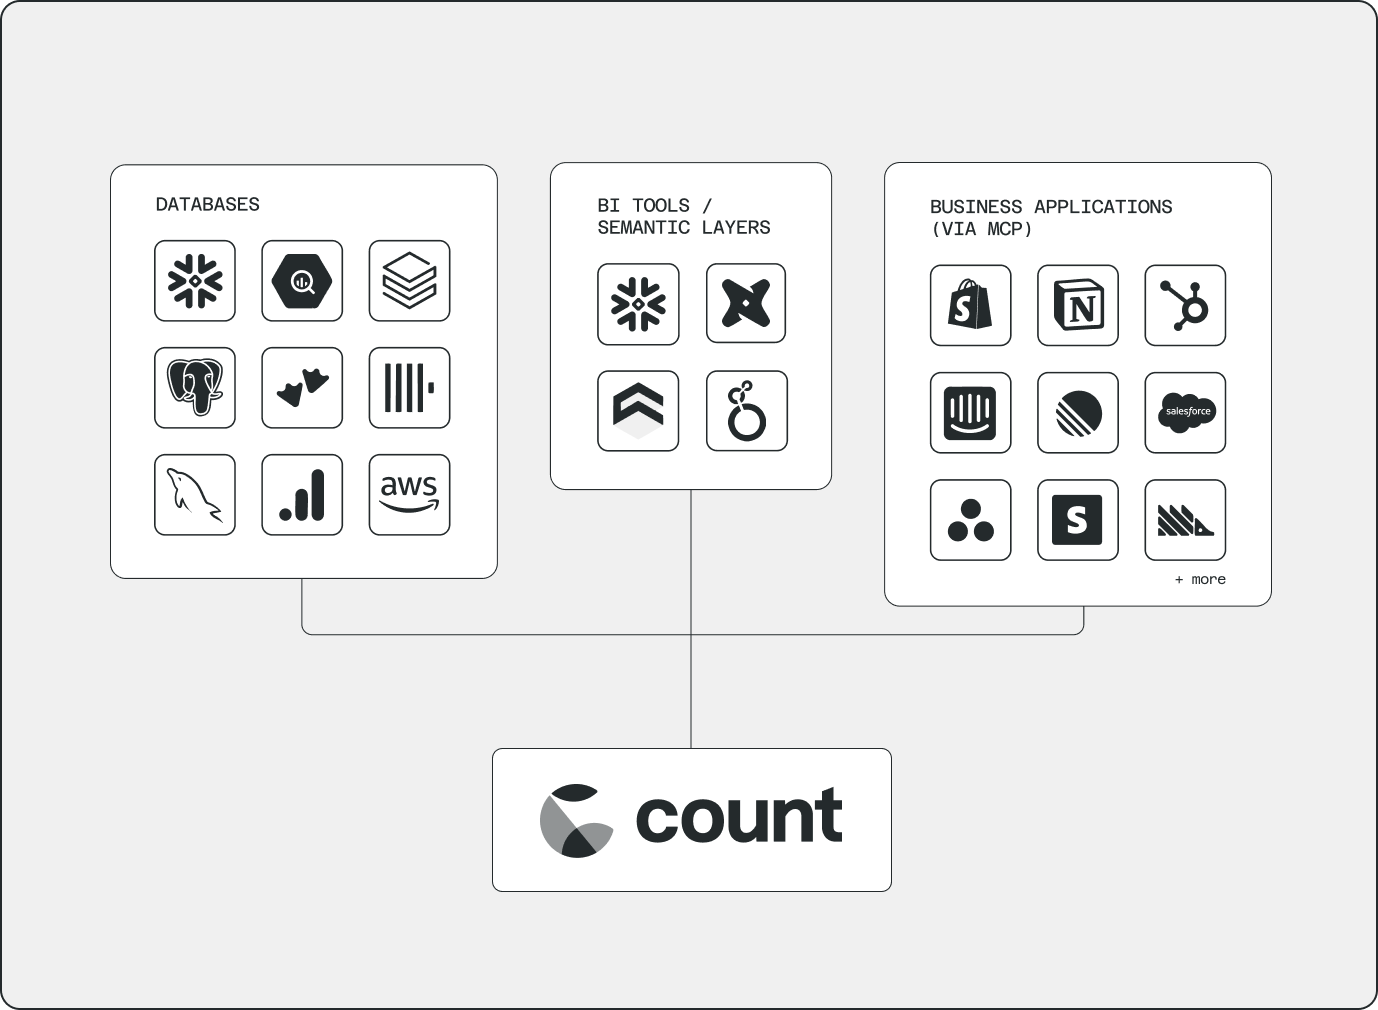
Notebooks typically connect to your data warehouse and that's it.
But the most valuable answers come from combining data from different places in novel ways - your CRM, billing system, product analytics, spreadsheets.
Count connects your warehouse, semantic layer, CSVs, and business tools via MCP servers directly in the canvas.
No new pipelines. The question drives the analysis, not what's already been modelled.
Compare Count vs Data Notebooks
Count doesn’t replace the power of notebooks - it brings it into a more collaborative, flexible environment.
solving
in the age
of AI.
Problem solving in the age of AI.
A field guide for data analysts who want to deliver reliable business impact with data.
- →The 5 capabilities that define the best analytical problem solvers
- →10 problem-solving frameworks with worked examples
- →How to leverage AI to support, not replace, your workflow
FAQs
Not exactly.
Most teams start using Count alongside their existing BI tool. Traditional BI is great for tracking metrics and sharing dashboards, but it’s not where people actually work with data. Count fills that gap — giving you a space to explore, analyze and think through problems.
Over time, teams use Count in different ways. Some move more of their reporting into Count, replacing static dashboards with something more flexible and collaborative. Others keep their BI tool for large-scale operational reporting, while using Count for deeper analysis and decision-making.
A lot of the messy, fragmented workflow teams rely on today.
SQL queries and notebooks for analysis. Slides for presenting. Spreadsheets for stitching things together. Slack threads for discussion. Count brings all of that into one place — so the work, the thinking, and the decisions stay connected.
Over time, many teams also reduce or replace parts of their BI stack. Instead of maintaining static dashboards, they use Count for more flexible, collaborative ways of understanding and improving the business.
Count’s agent is powered by leading models from Anthropic, OpenAI and Google.
It works with the context you provide (including your data, logic and previous analysis) and can run queries across the sources you’ve connected. This lets it explore questions, generate analyzes and go deeper, faster than a human alone.
Your data stays under your control. We don’t train models on it, and the agent will always ask permission before accessing external data sources.
Count runs queries in three places: directly on your data warehouse or connected sources, on Count’s servers, and in your browser. This flexible approach lets you combine data across sources while reducing the load on your warehouse.
For many teams, this also lowers costs. By shifting exploratory work out of the warehouse, some customers see significant reductions in compute spend.
Count’s infrastructure is hosted in the US and EU, and you can choose where your data is processed.
Yes.
Count is built with security and compliance at its core. We are SOC 2 compliant and adhere to GDPR requirements, with support for HIPAA where needed.
We apply industry-standard practices across data access, encryption and infrastructure to ensure your data is protected at every step.
For full details, visit our Trust Center at trust.count.co.