Cleo gets faster, deeper, and more democratized insights with metric trees on Count
Cleo helps 6 million people avoid their overdrafts, build credit, and budget better with their AI assistant. With their metrics clearly laid out and visualized in Count, complex analysis and collaboration is simple and fun.
"Count's intuitive canvas and metric mapping capabilities have fundamentally changed how we interact with data."
More Clarity with Metric Trees
Prior to adopting Count, Cleo relied on traditional data tools like Periscope and static CSVs for data analysis. This approach was limiting, particularly in visualization and collaboration. It only allowed for standard chart layouts and because it required separate queries for each chart making the end report was less interactive.
In Count, Cleo's data team was able to construct a visual hierarchy of metrics, starting from high-level business goals down to granular data points all in one shareable canvas. This Metric tree approach provides a clear roadmap for data exploration, making it easier to pinpoint the root causes of changes in top-level metrics.
"Metric trees have become our go-to framework for drilling down into data and uncovering the layers that influence our key performance indicators." Callum Ballard, Analytics Lead at Cleo.
More Collaboration in a Canvas
At Cleo many teams need data to inform their decision-making, however, previous tools’ high learning curve drove many to reach out to the data team for ad hoc questions. With Count’s friendly canvas UI – product managers, engineers, and non-analysts began to conduct their own exploratory analysis, enabling a broader base of decision-makers to glean insights directly from data.
These teams also benefited from the metrics trees the data team built quickly seeing what metrics drive each other instead of needing to send a Slack message. This led to a significant reduction in time to insight, as stakeholders could independently investigate and understand data trends without relying on the data team for bespoke analyses.
"The ability for non-data folks to dive into the data and come up with insights has been a game-changer."
Less noise, more signal in Count
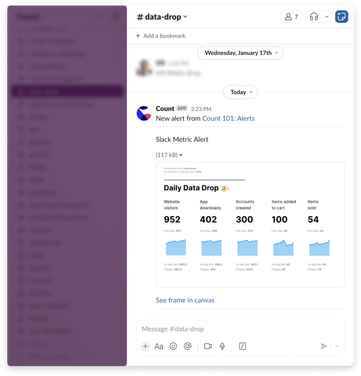
A standout feature that set Count apart was its advanced metric alerting system, which offered a level of flexibility and automation not found in other platforms. Count's alerting functionality, driven by SQL queries, allowed Cleo to monitor key metrics dynamically, adjusting thresholds based on historical data trends. This innovative approach ensured that the team was always attuned to significant shifts in data, facilitating timely and informed responses.
"Count's smart alerting capabilities have streamlined our monitoring processes, making our data analysis both proactive and responsive."

Putting data into the operating model
Implementing Count significantly reduced the time to insight, enabling both analysts and non-analysts to derive conclusions more efficiently. However, the most profound change is how it has created a culture of data-driven exploration throughout the organization.
PMs use Count for sprint planning, Marketing uses Count to map out their funnels, and the data team even uses Count for creating their dbt models. Count makes data fundamentally more flexible and collaborative by putting it into a canvas with all the tools you need.
"With Count, we've ventured into new analytical territories, uncovering insights that were once beyond our reach."