Giving AI space to breathe
Today we’re launching the Count Agent.
This isn’t another chatbot. This is a new way for everyone in your org to work with AI to create trusted, actionable analysis at scale.
Removing the limitations which hold AI (and humans) back
At Count, we’ve believed for a long time that the biggest opportunity in analytics is improving how humans see and interact with data and turn it into decisions - the so-called “last mile of analytics.”
We’ve been excited about the potential of AI to help with this problem for a while. What’s become increasingly clear, especially with the latest generation of models, is that the limiting factor is no longer the models themselves but the interfaces we use to work with them.
Today, we’re launching the Count agent to show how AI can unlock the potential in data that organizations have struggled for years to fully tap.
What sets the Count agent apart isn’t the models we use (that’s a discussion for another day), it’s how the agent gives bothhumans and AI models better tools to work with data.
At the core of our new agent are three innovations which we believe make Count a step forward in agentic analytics:
- A collaborative interface flexible enough for humans and agents to work together and actually make decisions
- A compute layer that gives AI all the power it needs to go further and faster than any human
- A governance layer to give data teams the control they need to scale agents across their organization
From feedback from our customers we believe these make the difference between using analytics agents experimentally and actually being able to use them across your organization with confidence.
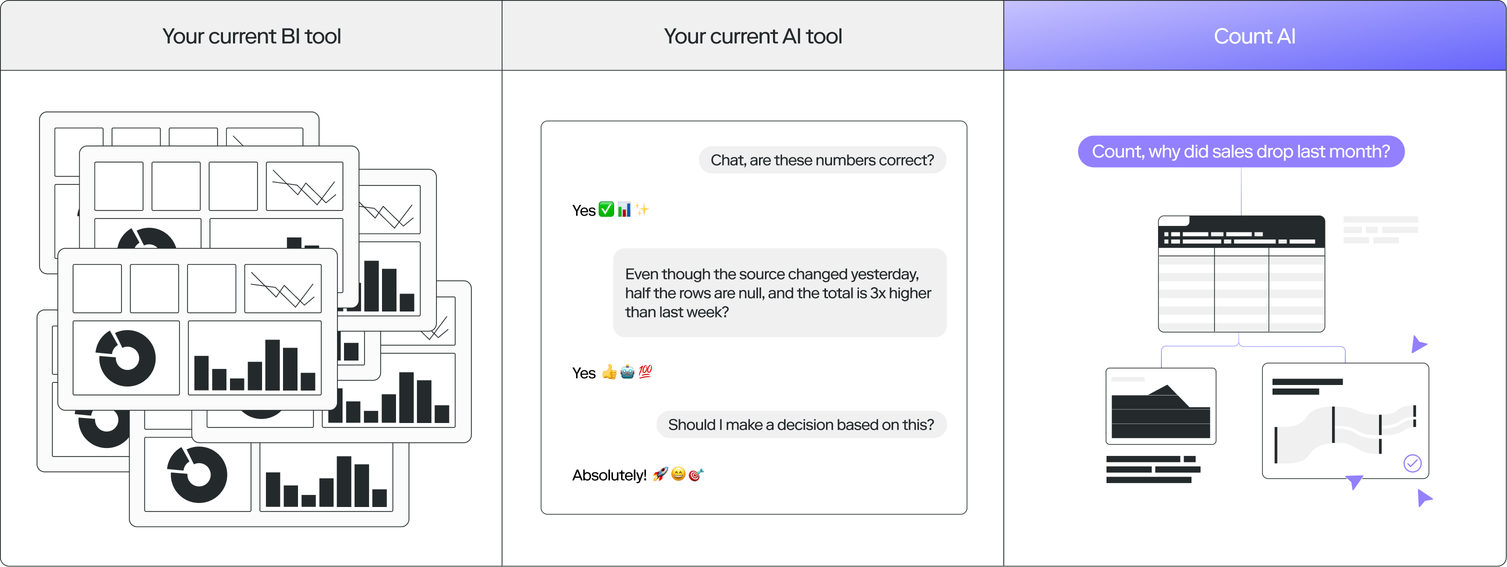
No more black boxes

Chat interfaces are a natural interface for… chat. But they’re not great for the nuance, breadth and fundamental information density of data work.
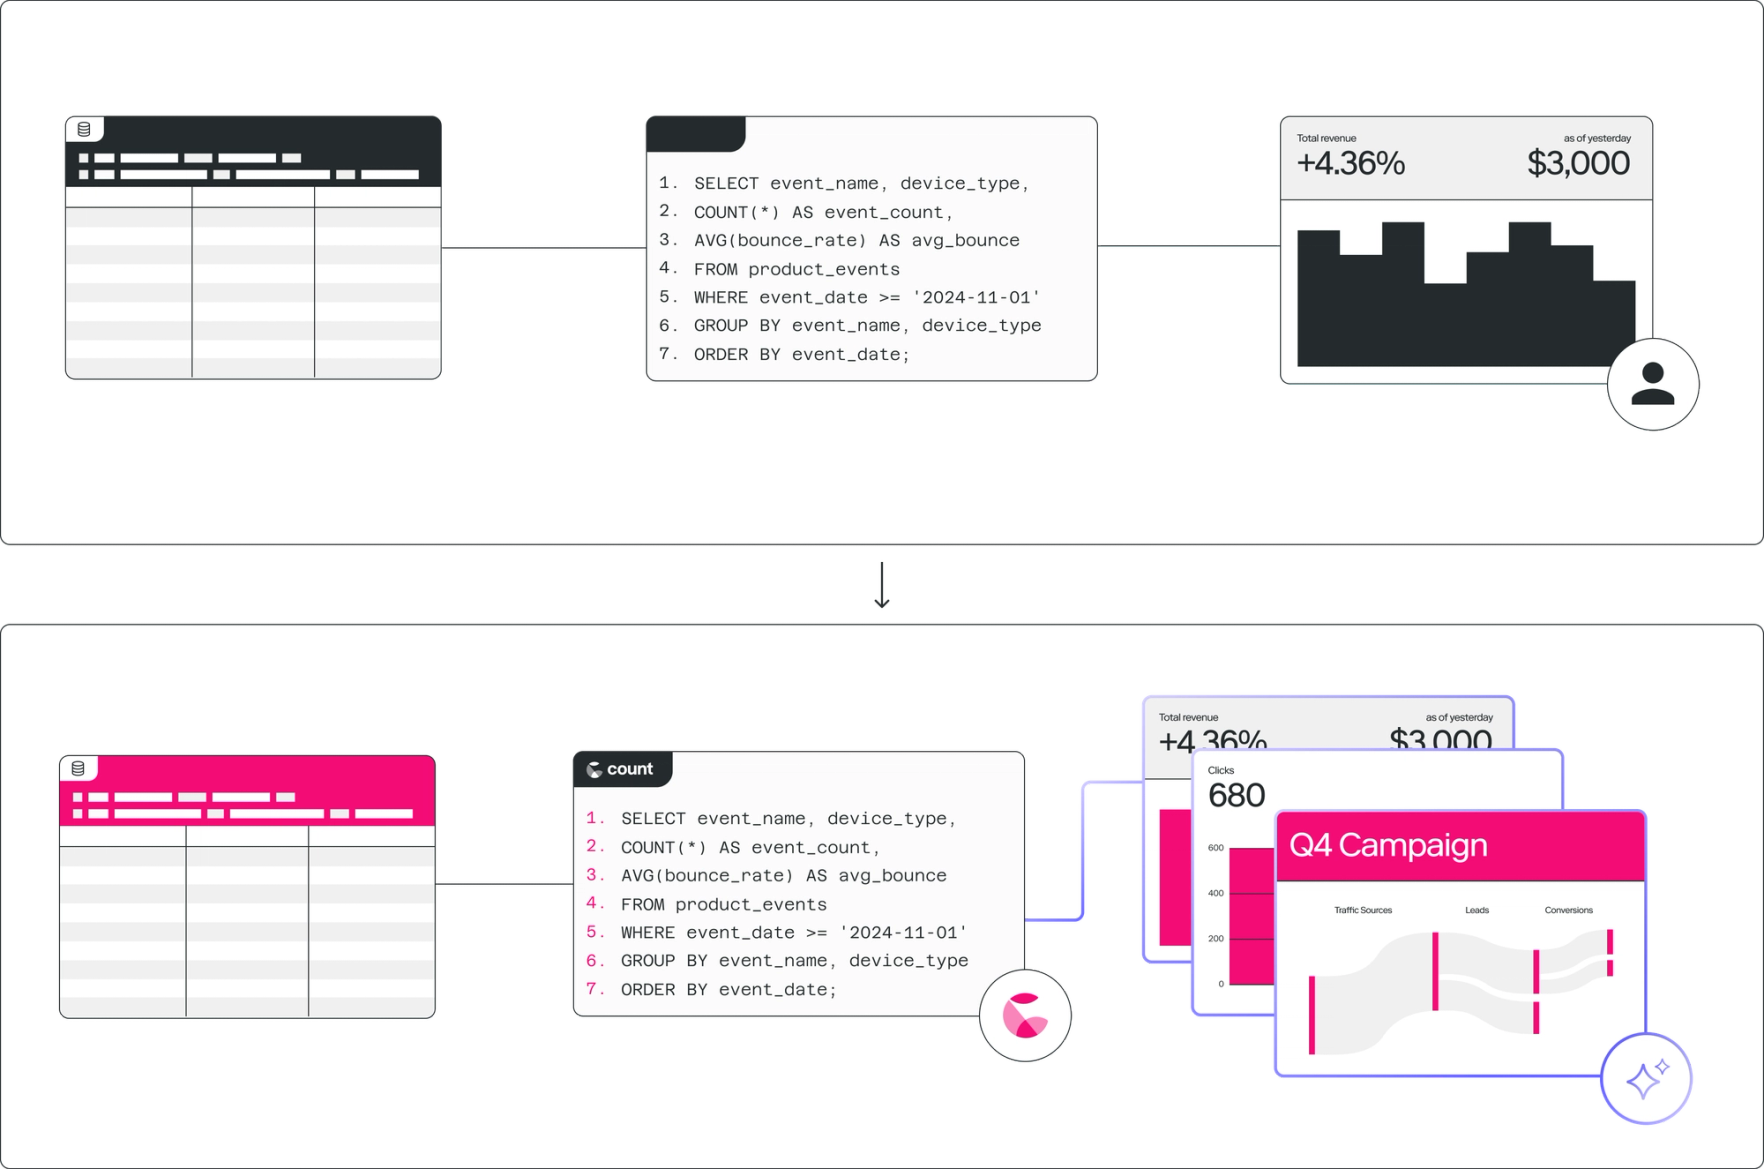
Our collaborative canvas gives agents the space and flexibility they need to go deep. They can lay out their thinking in a structured format, show their working, and create any kind of final asset, be that a data model, dashboard, report, slide deck, or metric tree.
Crucially, everything the agent produces is editable, auditable, and reusable. You can inspect the logic, adjust assumptions, and build on the output rather than treating anything the agent creates as an opaque result.
This is where the magic really happens. The canvas allows humans not only to work together, but to seamlessly integrate the agent AI as an extension of the team - digging in, riffing, sharing context and reasoning together as they work through problems and reach conclusions.
The compute to turn AI into the best analyst you know

It’s obvious that AI can write code faster than any human.
What’s less obvious is that most data warehouses simply aren’t built for the speed or depth at which an AI can work, and so end up being the biggest bottleneck for scaling agents and bringing out their full potential. Or to put it in a slightly colloquial way - either an AI slams your data warehouse to gets the data it needs or it resorts to just making stuff up…
To solve this, Count’s compute layer intelligently distributes work across your data warehouse, our servers, and even your browser, giving agents the freedom to dig deeper and check their work.
This means Count’s agents can run hundreds of queries from a single prompt, and that volume of exploration makes them more accurate and more powerful than your typical LLM + DB setup.
We’ll share more on how this works soon but to give you a sense of scale currently 60% of all queries in the Count platform run on our user’s local machines and this creates enormous pool of compute to use agents across your organization without blowing up your data warehouse.
The controls you need to deploy analytics agents at scale

All the power and speed in the world doesn’t matter if agents simply create organizational chaos. The Count platform has all you need to scale agents safely.
Count Metrics, our semantic layer, gives agents the definitions, documentation, and guardrails they need to produce accurate, consistent work, with everything version-controlled and easy to maintain.
Count Metrics also plays nicely with the rest of your stack. You can reference metric definitions from other semantic layers (e.g. LookML, Snowflake cortex) within Count so you can have a single source of context to maintain whilst being able to leverage Count’s compute layer in other tools via an API.
Layered on top of this are enterprise-grade permissions and security, so teams can confidently control who can see, use, and build what as agents roll out across the organization.
This is a watershed moment for analytics
For decades, data teams have struggled to keep up with the sheer volume of questions their organizations want answered. In just the last few months that dynamic has started to change. Everyone can now have their own, personal, world-class analyst helping them get answers and solve problems.
The goal of the Count agent is to give humans and AI the workflow and tools to make those answers are as valuable as possible. Welcome to a brave new world.