Count + dbt: Making your data models radically transparent
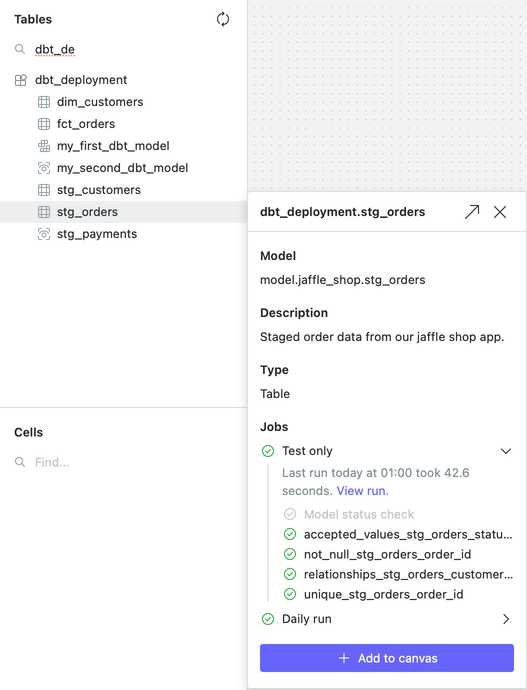
dbt has fundamentally changed how most data teams work. It lets them create, and maintain complex data transformation models that power nearly every dashboard, report, and insight within an organization. While the Count canvas is already a valuable way to explore anddebugyour dbt models, today’s launch significantly improves that experience.

By connecting the Count canvas to your team’s dbt Cloud instance you can not only see relevant metadata (e.g. test results, freshness) on your tables before querying them, but you can reanimate the logic behind your models in unprecedented ways. Each model (and its parents) can be imported to the canvas, and its CTEs decomposed into a DAG of cells and run against your live database. This means you can:
- take a database table, and with one click, import all the logic in dbt that created that model (from source to final output)
- decompose the CTEs of that logic into a DAG of interactive queries for better comprehension and testing
- run your model queries against any database, including swapping between dev and prod environments to test results
- further analyze any model queries to detect bugs, or to better understand the model
- update model logic and export dbt-ready SQL (customized jinja-syntax)
- prototype and get feedback on models from the data team and stakeholders
Fundamentally, with this integration the canvas makes your data models radically transparent - letting you, your team, and your stakeholders, understand, discuss, and iterate the logic behind your dbt models in unprecedented ways.
Want to jump in? Check out the details in thedocs.
Why transparency matters
One of the goals of the Count canvas has always been to offer transparency across three dimensions:
Transparency for individuals. Transparency for an individual means your work is not segmented across different platforms - data viz in one tool, your SQL queries in another, so you can work more efficiently. In data modeling, we most often run into this when trying to make sense of a model someone else has written or even trying to debug it for ourselves:
"In many cases, this consists of pulling the dbt model into a SQL editor, separating CTEs into their own editor tabs, and attempting to stitch together the model in this manner. A very siloed, manual process." - Josh Hall
Transparency within data teams. Being able to share and explain your work with your peers makes it possible to share your knowledge, re-use your code, and simply, get things done faster:
"Before we worked in complete silos with no collaboration. When we had to share code we fumbled around building something directly in dbt or tried screensharing from datagrip. Now I can just write a query, send a link, and we're working on the next model together." - Justin Freels
Transparency with stakeholders. Being able to showhow you arrived at a certain answer establishes greater trust with your stakeholders. This is especially true with data models that business users are expected to use. It must be clear not just what the column definitions are, but how the data went from the source tool they know to the table they're looking at.
"By showing them the queries in the canvas, [the stakeholders] instantly understood how much work actually went into their request. They went from being frustrated that it wasn't done to asking how they could help. The change was instant." - Zac Ruiz
This is exactly why we built the Count <> dbt integration - to give teams more transparency than ever into their data models, helping them to find and fix problems faster, prototype and iterate with stakeholders, and learn to work more efficiently together.
So let's dive into the details!
1. Metadata
Every dbt integration has metadata. This is helpful, but to us, not very exciting. Our integration does also bring forward dbt Cloud metadata into the context of the tables (and models) you want to analyze in the canvas. But keep reading to see the really cool stuff...

[2] Importing model SQL
The most exciting part of this release, though, is the ability to import model logic as a DAG with one click.
By clicking the ‘Add to canvas’ button in the metadata modal, you’ll see 4 options.
- insert a new cell with the compiled SQL of the model
- Insert a frame with the compiled SQL of the model - each CTE separated into its own cell
- insert a new cell for the model and each dependent model, effectively recreating your dbt DAG, except running on your database
- split out CTEs: same as above but each CTE will be broken down into its own cell, allowing you to see each step
A quick aside on the power of reactive updates:
You can also add models one by one. When you do that, the canvas will work out when you should update your cell references for you.
Once your models are imported, you can use the canvas as you normally would, including to:
- analyze any part of the model further
- duplicate a model frame and tweak the logic to compare results
- change the database the queries are running against to compare results
- build visualizations or end output like report prototypes to share with stakeholders
- invite teammates in to review your code or get help
- add sticky notes to document why you’ve made certain choices, then invite stakeholders in to better understand the model
3. Exporting model SQL
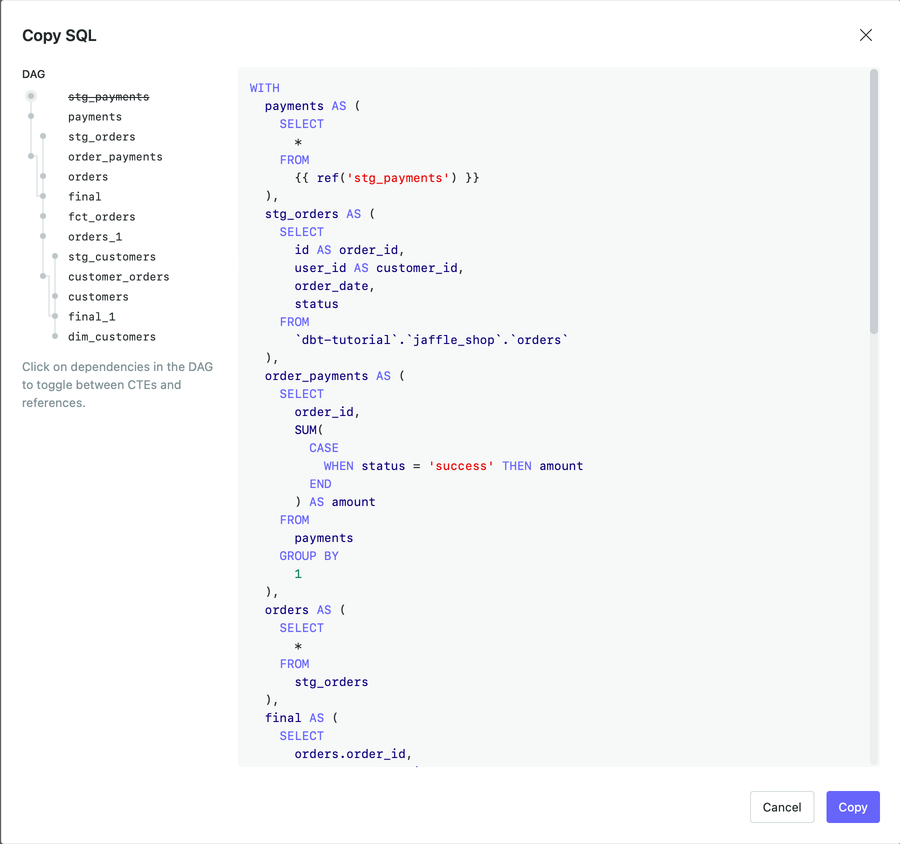
f you’ve made edits to the logic of a model, or even have created a new model, and want to commit those changes back to dbt, we’ve created a new Copy SQL feature to help.

Within this pane, you can copy the compiled SQL of a cell out of the canvas. Using the options available, you can customize exactly which parts of your cell’s DAG should be replaced by references to other models, or which should stay as CTEs.
This SQL can then be copied and pasted into dbt Cloud, or into your IDE of choice before committing to your code base.
What about dbt core?
This feature in particular is helpful for dbt Core users as much as dbt Cloud users. dbt Core users can build out their model logic in Count, then export each frame as a model into their IDE and continue their CI/CD process as normal.
Want to see how teams are using Count for end-to-end data modeling? Explore our data modeling workflows.