More than a dashboard - how to make sure your metric tree succeeds
Written by The Count Team
Unlock the power of metric trees: enhance understanding, foster collaboration, and drive strategic insights beyond traditional dashboards.
After I wrote about metric trees a few weeks ago, I received a lot of questions about them, but none stood out more than this one:
“At the end of the day, aren’t metric trees just another dashboard?”
This is correct at some level. If you build a metric tree like you build a dashboard - which is to say alone, and as something you serve to the business - it is likely to have many of the same issues.
So are metric trees different? Is there more to gain here than a handy new way to display data? And if so, how do we make sure we achieve that vision?
About more than communication
“I think my stakeholders will really respond well to presenting metrics in a tree. I hope the hierarchy and connections between metrics are more obvious than they are in the current dashboards we use.” - Anonymous Data Leader
It’s easy to look at metric trees and think the big idea is the visual structuring of data. It’s true, that presenting metrics in a tree means you can:
- clearly show hierarchies and relationships
- reduce the cognitive load required to maintain those relationships
- improve recall by calling on spatial memory rather than remembering text or numbers
- encourage greater universal understanding of metrics (easier to do with visual representations than with text)
Visual diagrams like trees are tools we should all be making better use of as we try to become ever-better communicators, but this is not the only fundamental idea behind metric trees.
Presenting your existing metrics as a tree today will lead to more understanding, or at least more engaged questions about the metrics that can lead to better understanding. But what if there’s a problem with the metrics themselves?
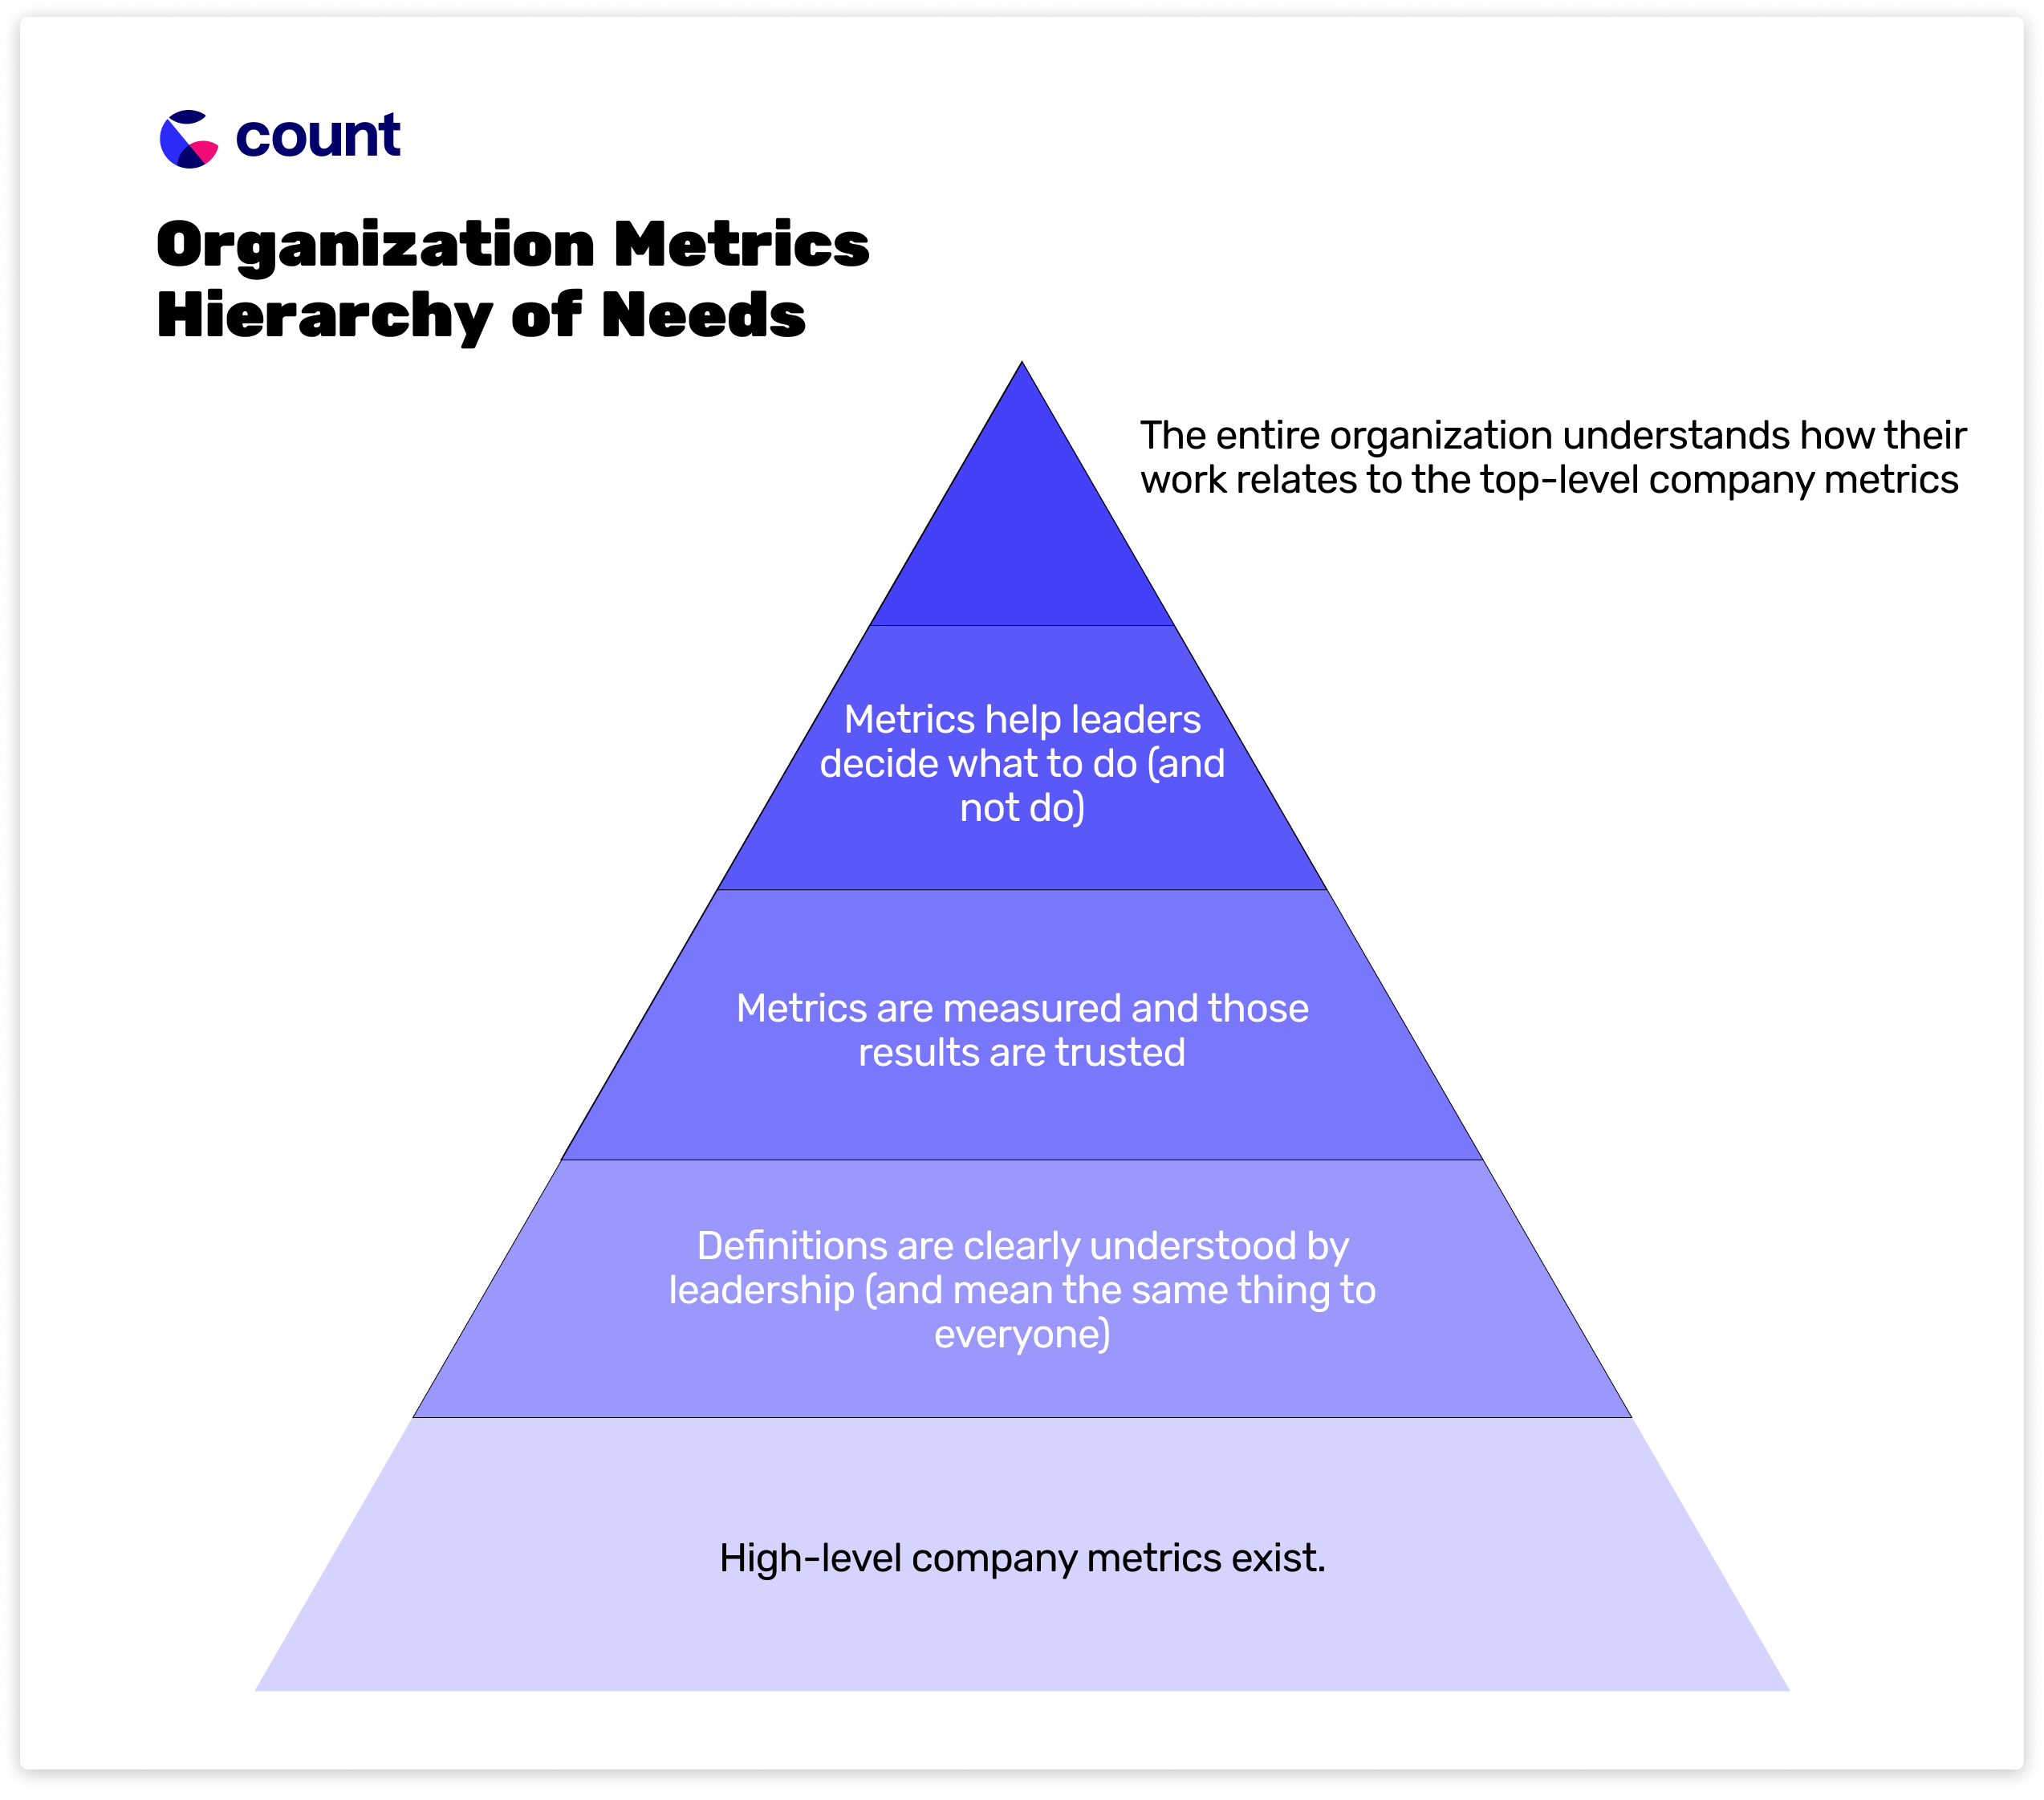
The problem with metrics
The biggest problem with your company’s metrics is unlikely to be how they are presented. It’s far more likely that no one understands the metrics, or what it means to them. Maybe the metrics don’t even exist yet or are set at the wrong level of detail that they don’t effectively inspire action.
How the data team can help
So what does this have to do with the data team?
“The thing with the KPI tree is really, if I understand these levers, I can design experiments to help increase them.” - Matthew Brandt, Decision Scientist at Well
The biggest transformations I’ve seen metric trees contribute towards are those in which the data team goes beyond presenting the metrics and takes responsibility for the metrics themselves. They don’t just visualize and report on them, they sit down with leaders and help them work out what the metrics should be, they hold regular meetings to make sure the results are understood, and they use those metrics to inform projects, experiments, and strategy.
Metric trees give data teams a bigger role in the organization. They are one way to break the service cycle and become partners.
Of course, this does not apply to every tree (sometimes a tree is just a tree), but it’s important to recognize the potential behind them.
We are more than our assets
Another pattern I’ve noticed around the metric tree discussion is the difference in how teams internalize the value of a data team. For example, some data leaders look at a metric tree and ask how to deploy these metrics to dbt. There’s an implicit belief that theoutputsof a data team - our dashboards and models - are what define our success.
If, however, you see a data team’s ability to think through complexity, problem-solve, and challenge the business, as an equally valuable resource, then metric trees in this context make more sense.
Furthermore, with that mindset, you can see how sometimes the ‘tree’ of a metric tree isn’t the point:
“Metric Trees are certainly a useful way to help us understand, reason about, and communicate about how our organizations work. They're useful to the extent they do that well. But they're not the only way -- and aren't always even the best way. In fact, most of the best "metric trees" aren't trees at all -- they're growth models in spreadsheets.” - Abhi Sivasailam
How to make sure your metric tree succeeds
Then how do we make sure our trees become more than another dashboard?
1. Don’t build alone
You can’t build a metric tree alone. For one, there is too much business context for you to possibly understand. And secondly, any project is more likely to succeed when the end-users are involved throughout the process.
Example - creating a project team of 4
One data leader worked with 3 business leaders - the CEO and two business division leads - to build their metric tree. The four of them met once a week and discussed first what the company metrics should be, the nuances of those definitions, and then as the data leader brought in live data, the results of those metrics.
Having a small team that has both the context and the motivation to complete a metric tree, and a regular meeting schedule is a great idea for any metric tree project.
2. Be flexible
As you sit down with your metric tree team, you may find out you don’t need a tree at all, or not the tree you imagined.
Example - combining a tree and a funnel
In one example of building a tree, a data leader noticed how frequently the debates on metrics were being sliced into parts of the funnel, and cohorts - e.g. “For new users on mobile, we really care about retention, but for long-time customers, we really care about advocacy.” So instead of building a typical tree, this data leader added rows and columns to his tree to isolate cohorts and parts of the funnel, while also looking at a hierarchy of metrics.
(It’s hard to describe but I hope to have an example to show soon!)
Don’t be afraid to be flexible, and do what’s needed to best represent your organization.
3. Change your definition of ‘done’
Metrics can evolve quickly, so don’t assume you can build this tree, add definitions to dbt, and be done. In most cases, metric trees are a living document that evolves with the business. Instead of seeing this as a failure, view the continued usage as a sign of success. Don’t rush to productionalize. Again, the value is the discussions and common understanding of metrics and strategy, not a performant data model.
Example - a tree spawns more trees
After the data leader from the first example had a tree that their project team was happy with, they started sharing it more widely. As the tree made the rounds in meetings and via Slack messages, he was quickly inundated with requests to add more branches and nodes to the tree. Over 6 months after he started the initial project, he and his team now out the company’s core metric tree, and also smaller trees for various parts of the business.