Overviews. Over to You.
Written by The Count Team
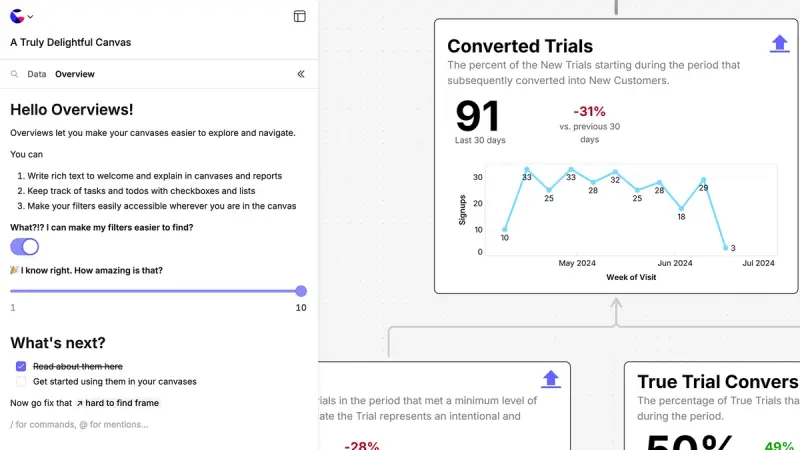
Introducing Overviews: Enhance your canvases with engaging, accessible summaries, AI-generated intros, and easy navigation. Start today for better data exploration and user interaction!
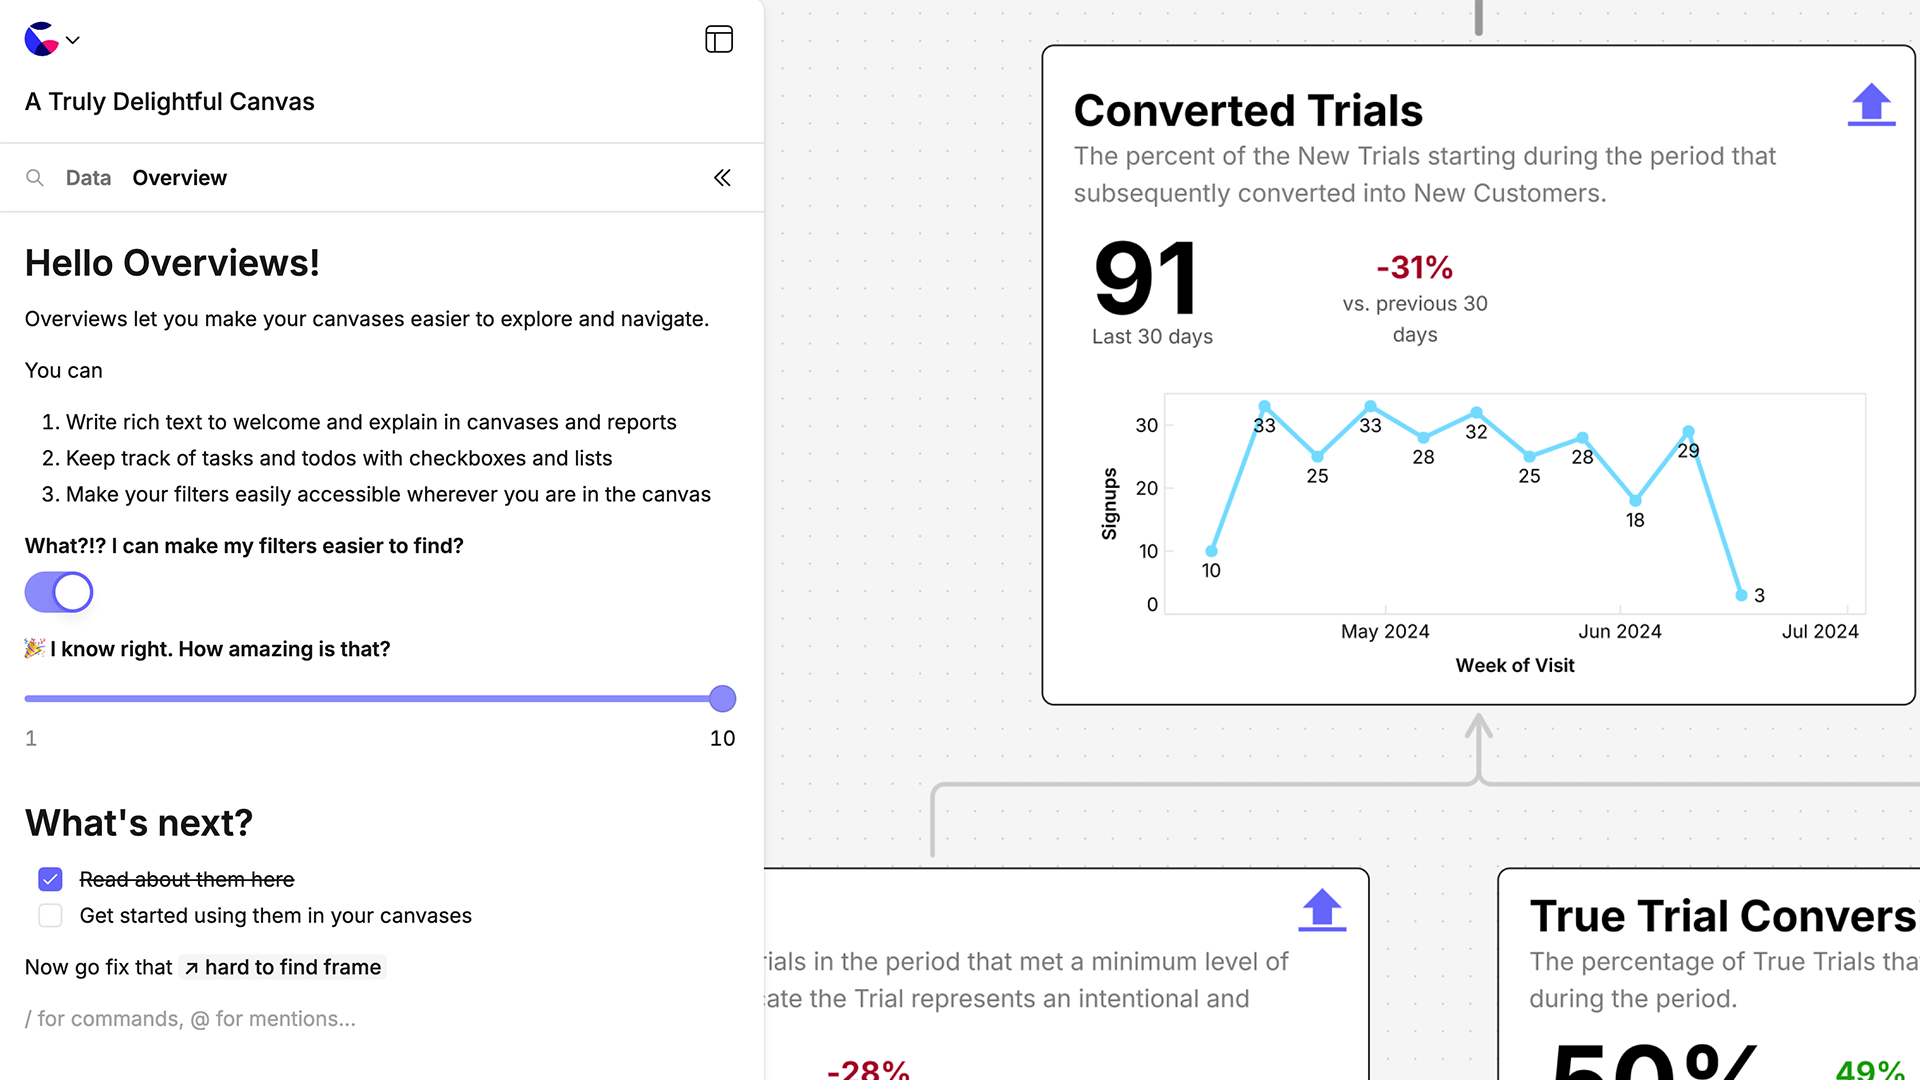
As your canvases become more comprehensive and more representative of your business, it's critical that they also become more welcoming, useful, and usable.
We're working on this one step at a time.
So, we're delighted to introduce Overviews—our way of documenting and elevating canvases so that they drive better engagement and exploration of data and business alike. You'll find them in the left-side panel on all your canvases starting today.
Here is a quick look at what you can do:
wistia-player[media-id='p1uph09uj2']:not(:defined) { background: center / contain no-repeat url('https://fast.wistia.com/embed/medias/p1uph09uj2/swatch'); display: block; filter: blur(5px); padding-top:57.81%; }
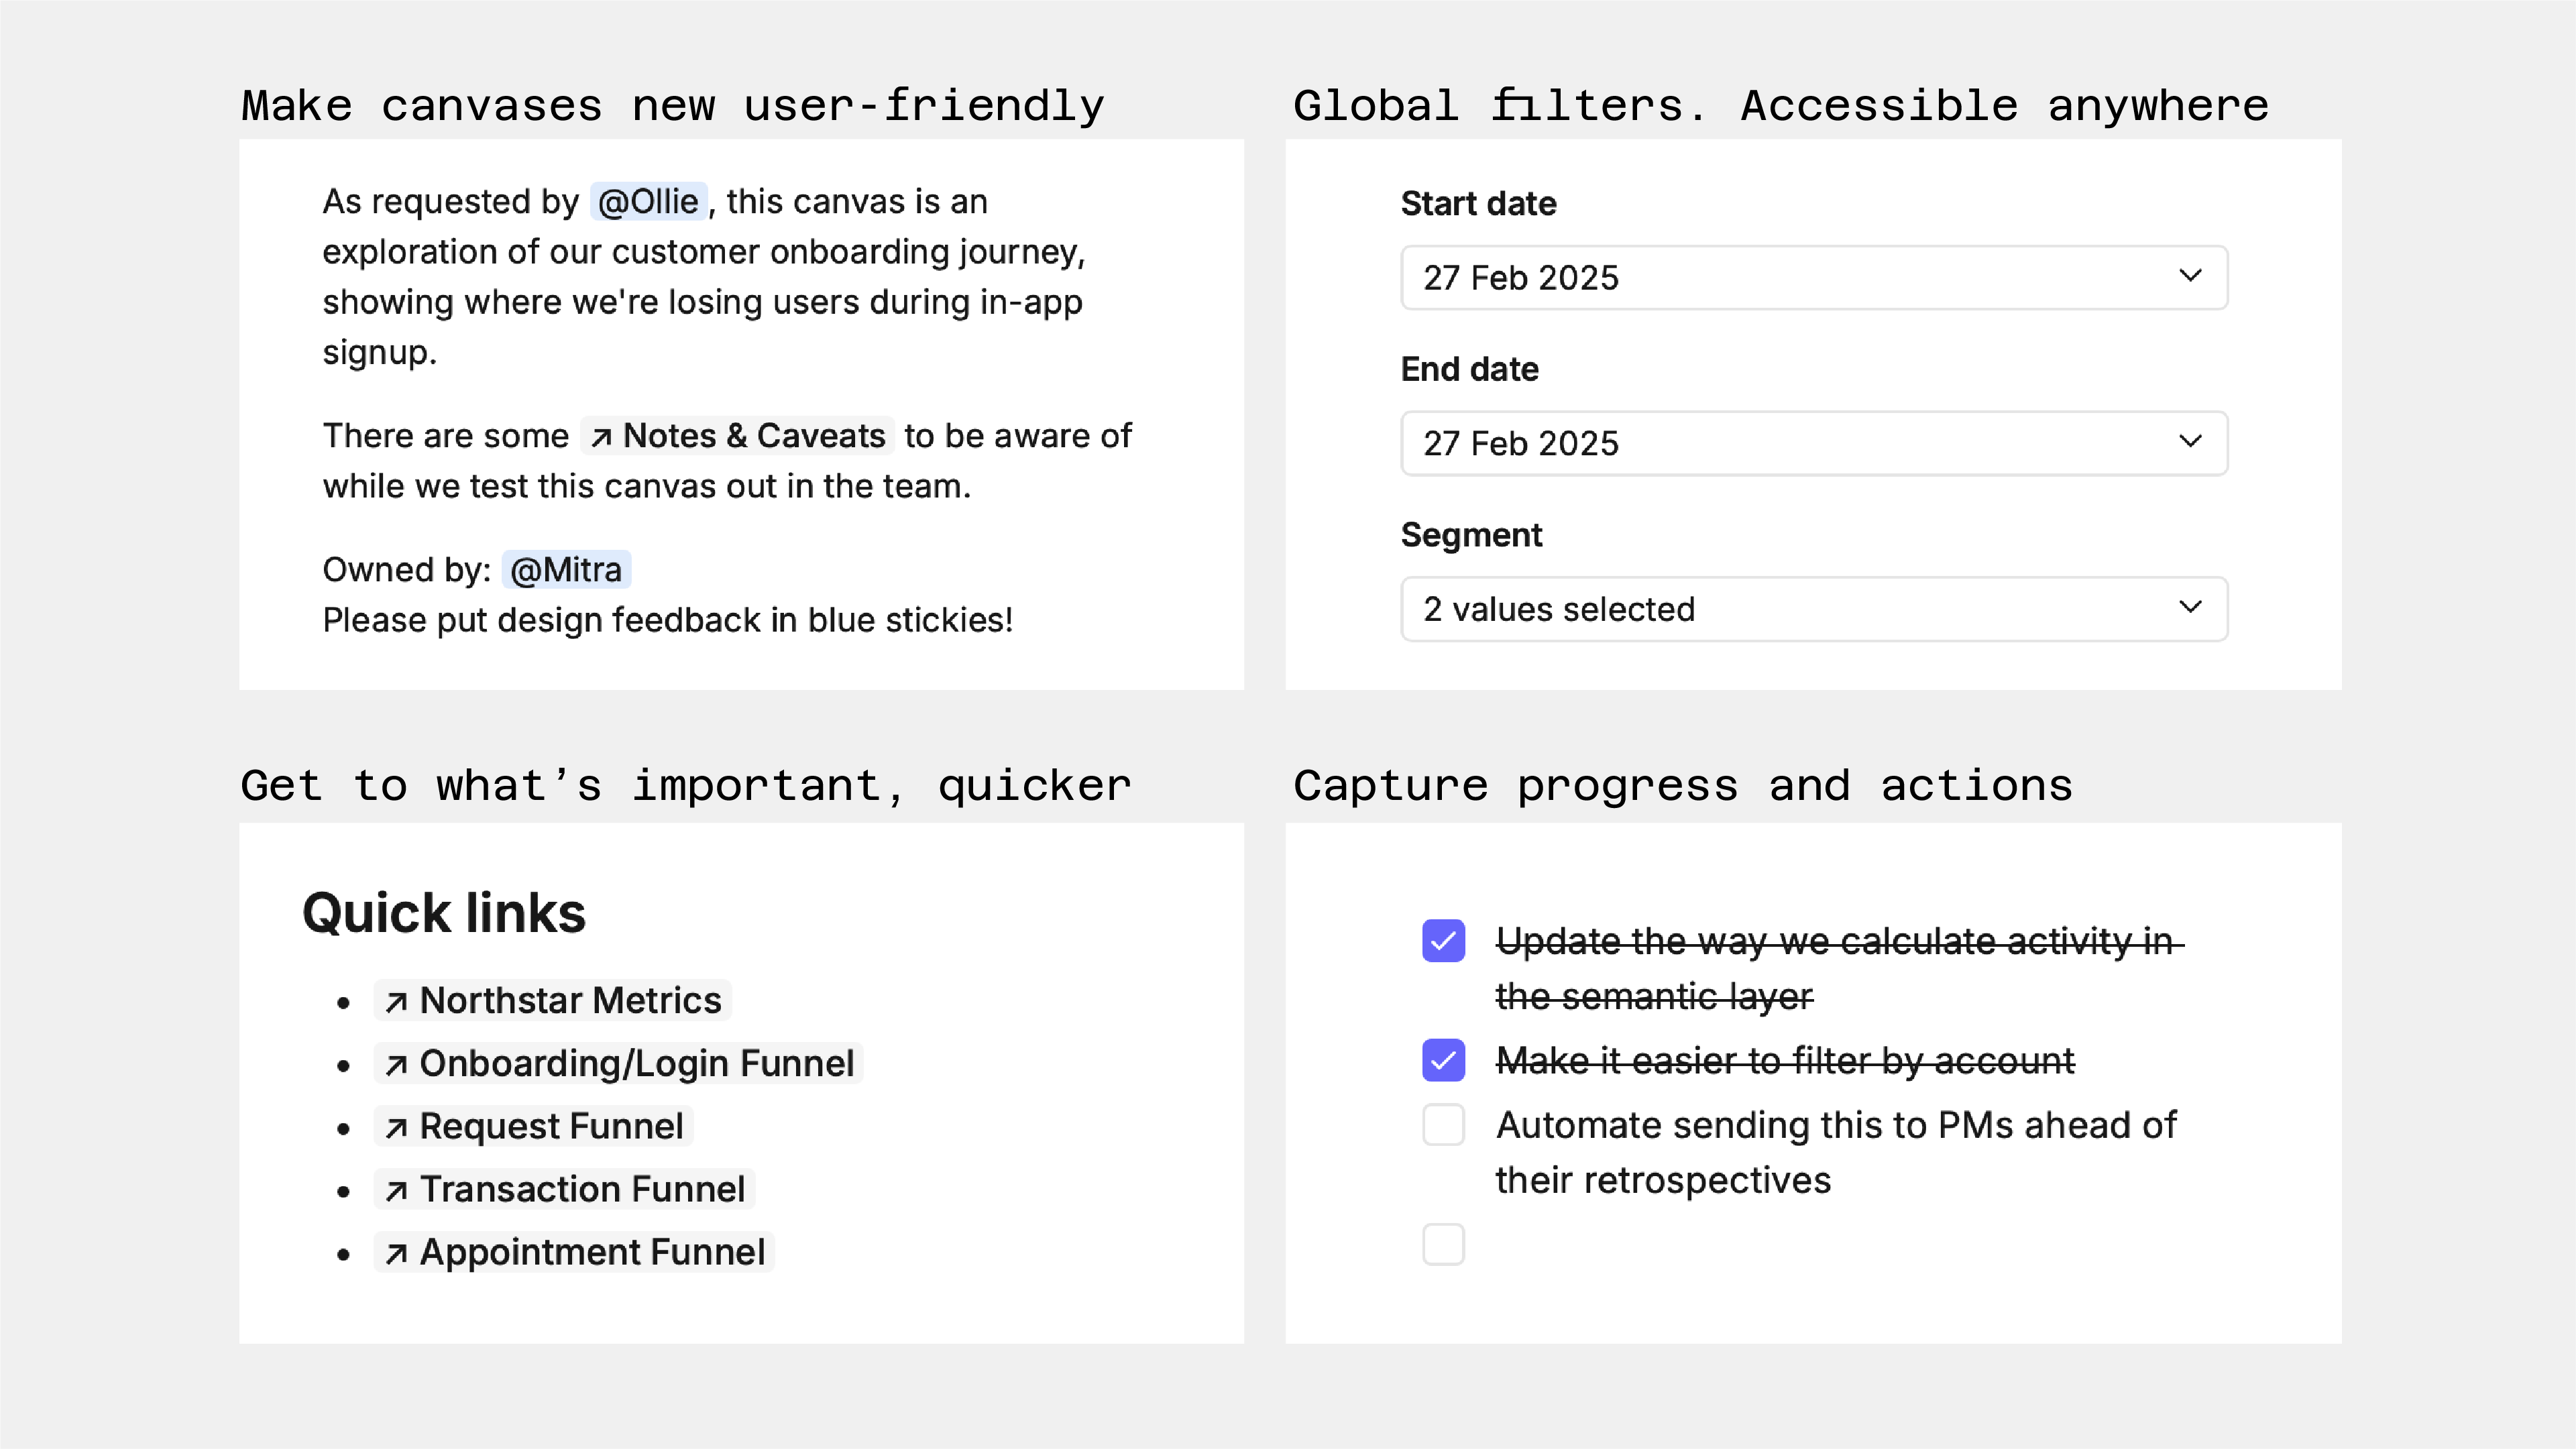
We're busy at work rolling these out across both our own internal canvases, andour public gallery of examples. Yes, we too will miss those awkward little intro boxes we never quite worked out how to style, but overviews nudge you to create better, more accessible, and more immediately useful work.
No one likes a blank canvas (overview)
To help you quickly roll these out in your canvases, we've also added some quick ways to get started.
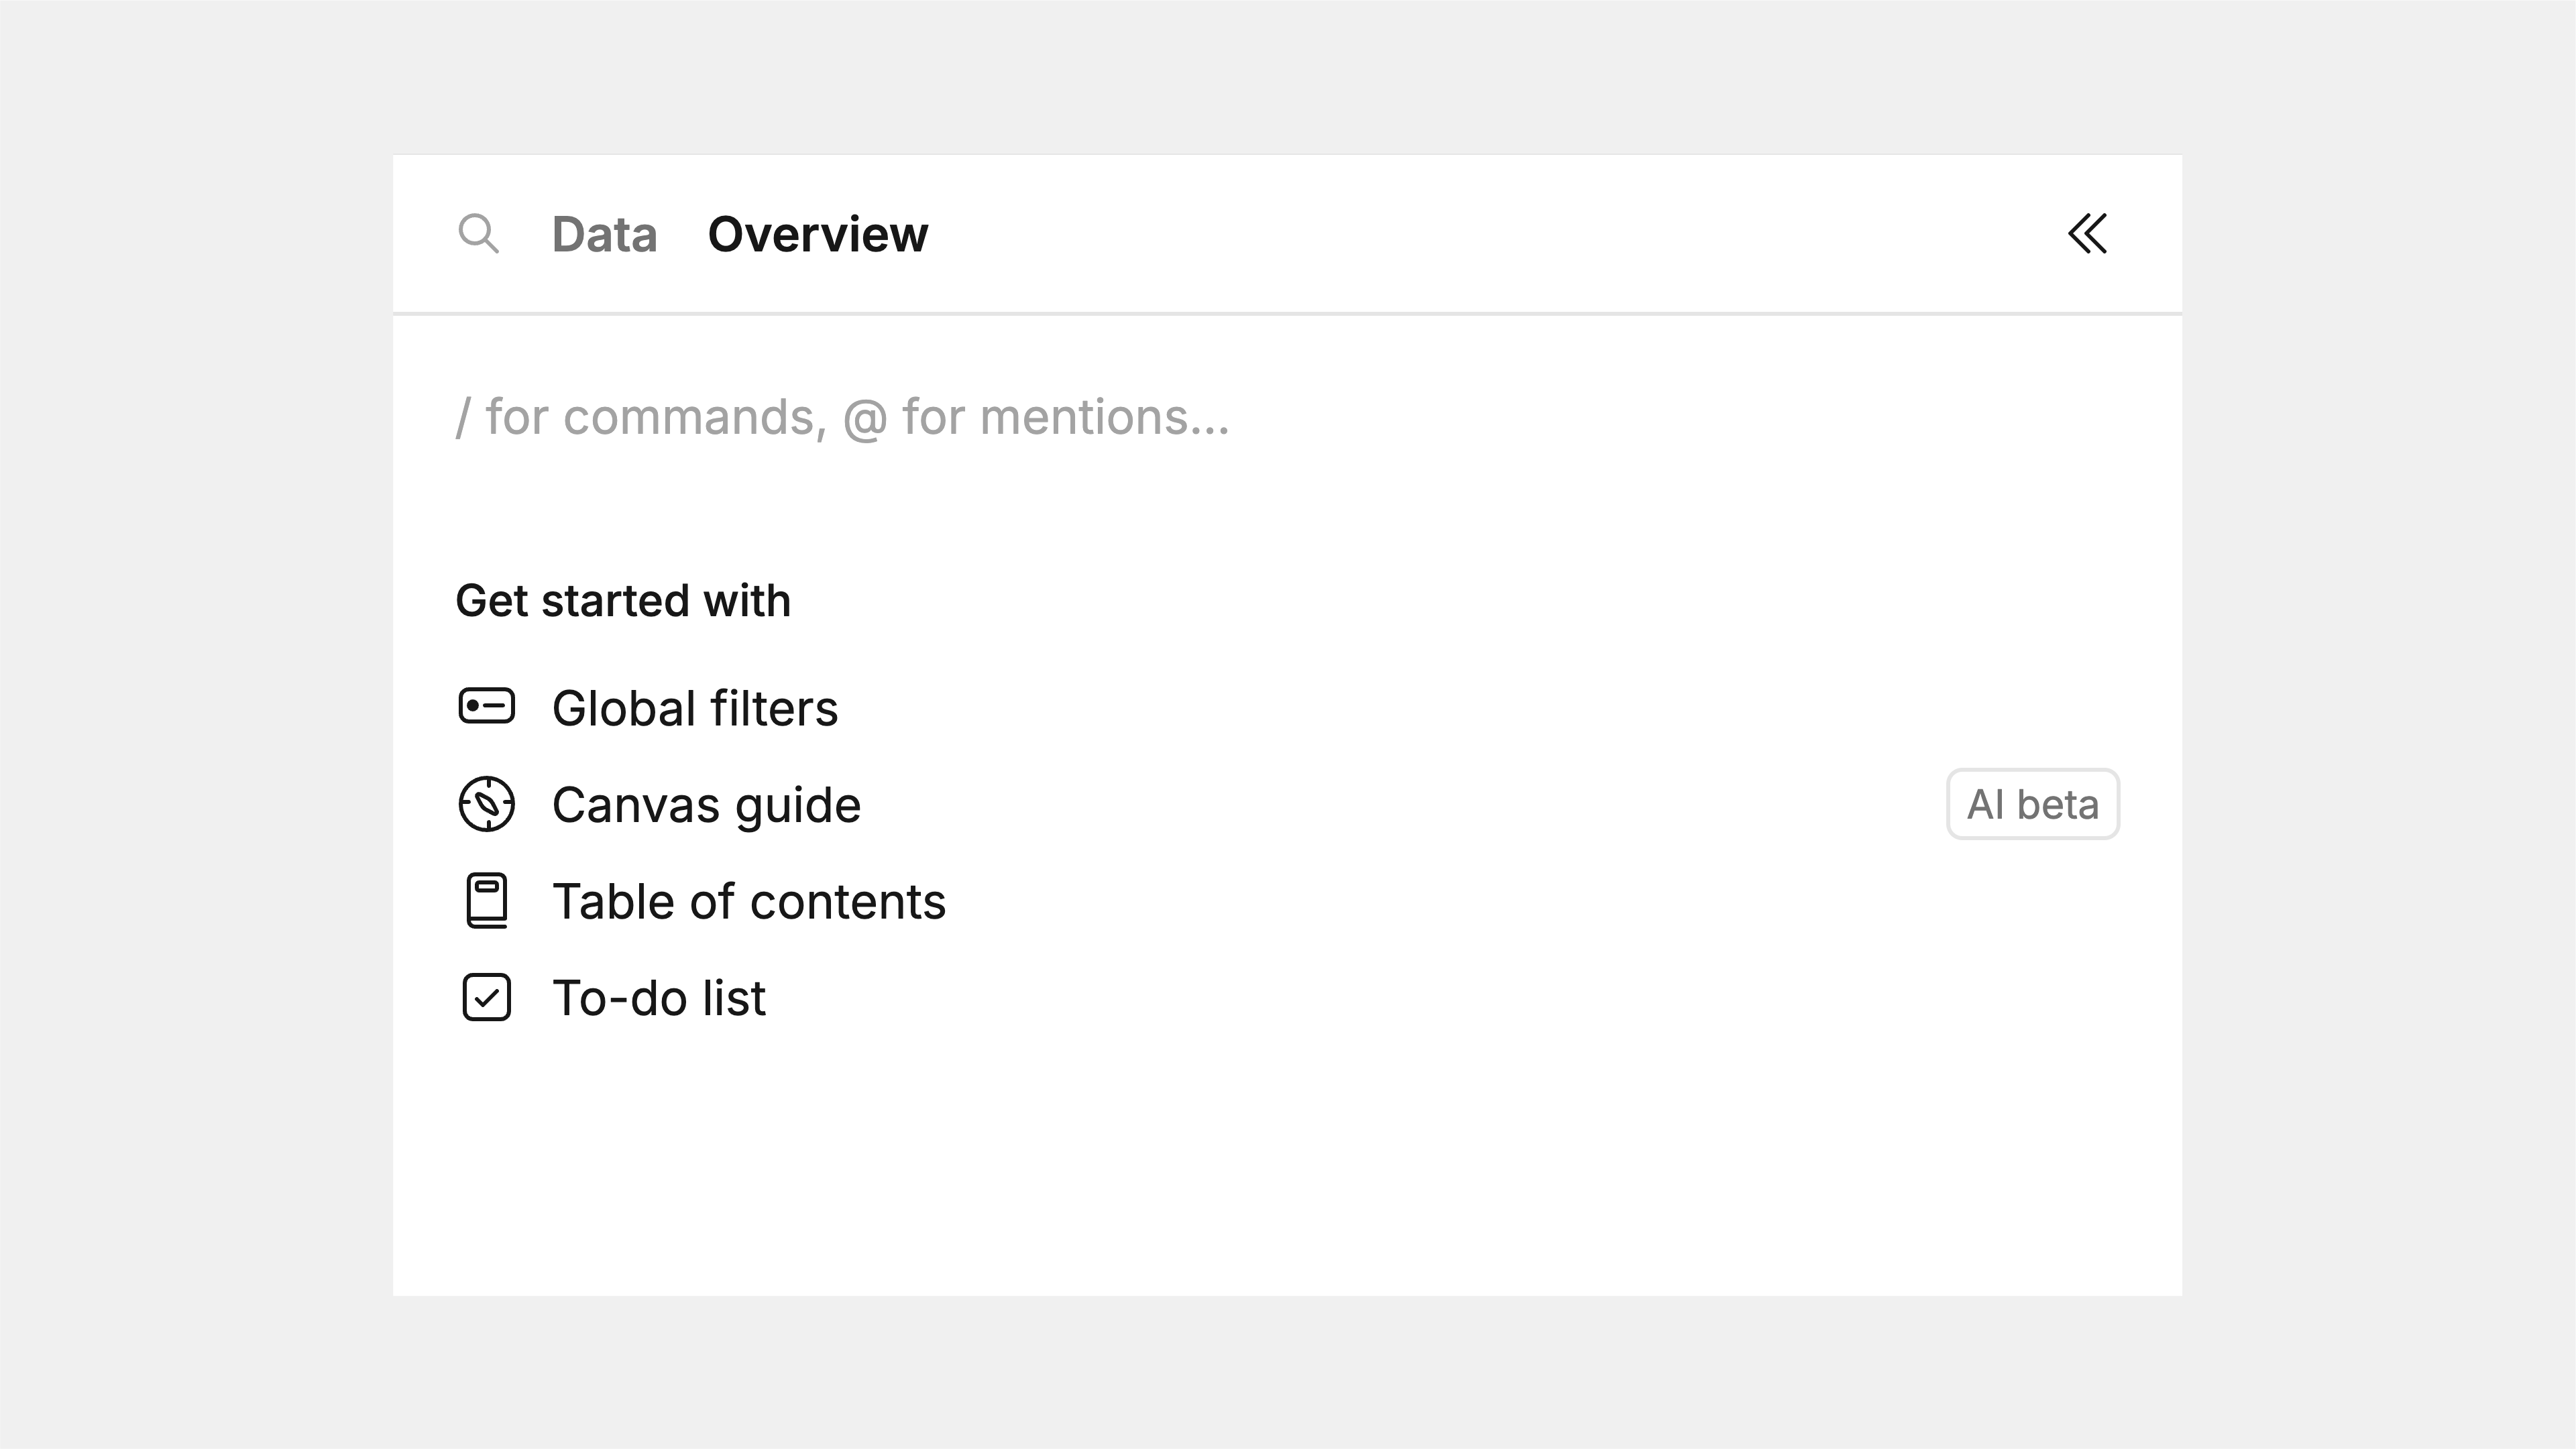
With a single click you can:
- Collate all your controls so users can always update filter wherever they are in the canvas
- Use AI (beta) to create a summary of the canvas to introduce it to first time users
- Create a clickable table of contents from cells and frames to speed up moving around
- Start a to-do list to capture and track your plans for the canvas
It's the small things
wistia-player[media-id='c49hl9zz3i']:not(:defined) { background: center / contain no-repeat url('https://fast.wistia.com/embed/medias/c49hl9zz3i/swatch'); display: block; filter: blur(5px); padding-top:55.83%; }
As part of building Overviews, a few tiny features fell out that were too good not to roll out everywhere. If we're letting you quickly create links to frames inside of Overviews, then we might as well let you do that anywhere.
In any text-cell in the canvas, hit "@" to create a clickable link to any frame or cell. Think of them as footnotes: easily send people to old versions of analysis or process diagrams/illustrations you have placed elsewhere. You can also use "@" to tag other people within your workspace.