Analysts with Impact: Count at Loqbox
Loqbox is a UK-based fintech that has helped 2 million people increase their credit scores in order to access a richer life. With Count, Loqbox analysts are freed up to do their best work - solving business problems efficiently and in close partnership with stakeholders.
The data team comprises 5 data analysts and one data engineer. Sara Sabzikari is an analyst embedded in the marketing, product, and commercial teams.
Their data stack is Redshift, dbt, and Count. (They previously had Tableau as their BI solution but replaced it in 2024 with Count).
Sara joined us for a live webinar in May 2024. Click here to watch the recording in full.
Onboarding 3x faster with Count
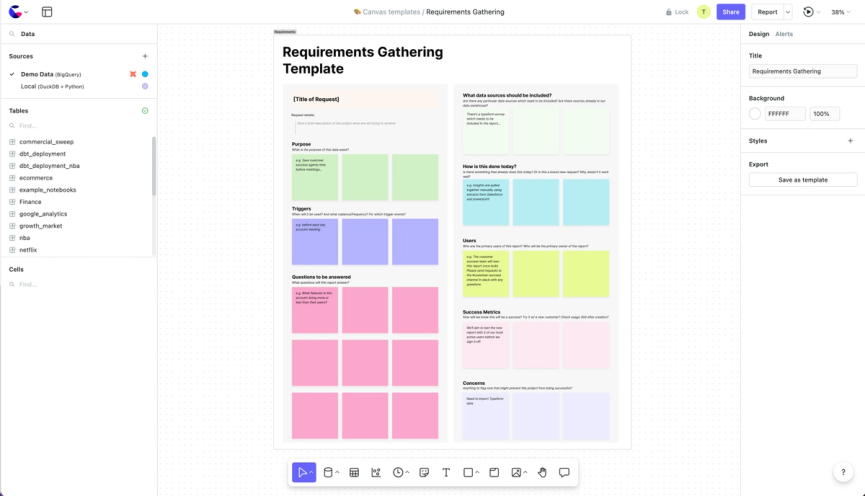
When Sara Sabzikari joined the Loqbox team as a data analyst, she faced a common challenge: getting to know the data model as quickly as possible.Knowing which tables to use (and not use), what each column means, and how that translates to a stakeholder’s language is crucial for any data team member’s success, so onboarding quickly is essential.Normally this is done in a SQL IDE where commonly used queries or dbt models can be run against the database and dissected. Sara, however, opted to do this in Count.To explore a new model, she would paste the SQL into a Count cell, explode all CTEs into their own cells, and start diving in. Since each cell is live and inter-connected, she could easily tweak parts of the query to make sense of it, add visuals to explore further and add sticky notes to document her learnings as she went.

“It became my own memo board of documentation. I was able to make sense of each model so much faster than any other time I’ve done this kind of exercise. I’ve never had that much transparency.”
As a result, Sara was able to integrate data and business context at breakneck speed, diving into significant data projects within just 2 weeks of joining, a process that often takes months.
Fixing fragmented workflows to go 2x faster
As Sara became a fully-fledged member of the data team, she came across what has become a common problem: fragmented analytical workflows. One particular LTV report was emblematic of this problem:
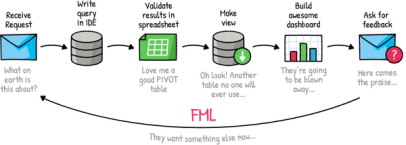
“Before Count, to build this report required 3 different tools, involved importing and exporting files locally and took up to 2 hours to implement. Now, the procedure is significantly streamlined: open one Count canvas, select a date filter, and in 2 minutes, the report is ready – transforming it into a significant strategic asset.”
The price of this inefficiency was twofold:
- It distracts the data team from the problem they are trying to solve
- It makes collaboration with stakeholders much more difficult
Count helped her team address both points:
Pursuing deep analytical work
“If you want to solve a complex problem without a clear methodology, you don’t want to spend your time moving between tools. You don’t want to have to debug things on different platforms and environments as it really strips away your ability to focus and lean into that deep work. I want to adopt things that enable me to be at the edge of my ability because that is how I’m going to do my best work. Count is that tool for me.”
For Sara and her team to be at their best, they needed a tool that let them focus on the problem at hand and have the flexibility to problem-solve creatively. The canvas lets them do the necessary work - from data modeling, exploration, analysis, visualization, and reporting - in one tool instead of switching between several. Moreover, it gives them the space to experiment with different approaches to find the best course of action:
Moving faster with efficient feedback loops
Fragmented workflows also impacted Sara’s ability to work closely with stakeholders:
“We used to get loads of questions from stakeholders asking ‘Where did you get this number from? What is the logic behind this methodology?’ And you can’t really answer it when you’ve used three different tools to get there. In the canvas, everything is there and transparent. Instead of spending time explaining myself, we can start working on what we do as a results of my analysis.”
A large enabler of this improved collaboration is the transparency provided by the canvas. Everything that’s been built is visible in the same place as the charts or data tables that are often presented on their own. This transparency significantly improves interoperability and trust.
The power of prototyping
A significant reason the stakeholder <> data team feedback loops have improved is the introduction of rapid prototyping.
“We wanted to get stakeholders involved from the beginning of our data projects to make sure we were building the right information and the narrative was clear. So we started getting together on a call - a half hour call - and mapping out what they wanted, how often they would use it, what other success metrics would be used to see if it was important. That conversation meant they could visualize the process earlier and were able to pre-empt the questions that can derail a data project, saving us on average a third of the time it takes to create and ship a report.”