Too Good To Go gets product analytics done 3X faster with Count
Too Good To Go connects customers to restaurants and stores that have surplus unsold food so less food goes to waste. With product analytics laid out in canvases on Count, deep product insights can be surfaced quickly.
"Count has not only tripled the speed of our data analysis process but has also simplified the way we organize and share insights. This has been a game-changer in how we approach product analytics and strategy development."
Unified Product Analytics
Before adopting Count, the product analytics team at Too Good To Go faced considerable challenges centralizing all the data they needed and then sharing it with the broader organization. This often resulted in the manual export of data to Google Sheets sent out via email.
With Count’sintegrations, the team brings together data from their MySQL databases, third-party platforms like Salesforce, and external APIs into a unified analytical environment that everyone can access with a link. This consolidation has drastically reduced the time and complexity associated with data preparation, enabling analysts to spend more time deriving insights.
“What used to be a disjointed and time-consuming process is now seamless and intuitive, allowing us to pull together data from diverse sources effortlessly."
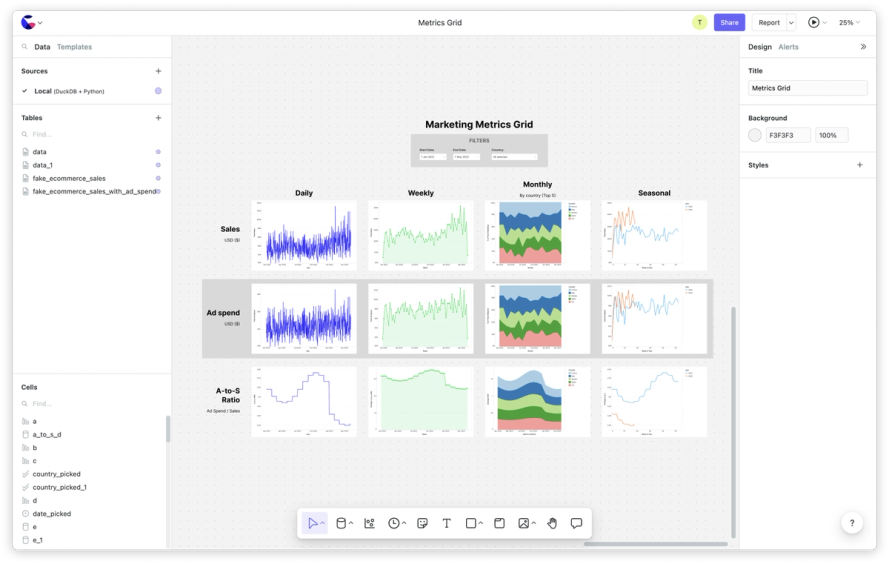
Faster Product Analytics
With their previous data stack it was incredibly time consuming to update and refresh and share analyses. With Count, product analysts can now build and update complex queries and models using SQL and Python and visualize the results instantly. When management’s curiosity is piqued, these results can then be built into reports complete with filters, date pickers, and more to segment and explore their data in real-time.
This allows the team to rapidly iterate on their hypotheses, explore data from multiple angles, and uncover hidden patterns and trends with unprecedented speed.
"The real-time analysis capabilities of Count have been a game-changer for us. We're now able to iterate and explore data dynamically, uncovering insights that were previously out of reach."
Shareable Product Analytics
One of Count's most impactful features for Too Good To Go has been how easy it is to share a Count canvas across the product analytics team and beyond. Analysts can share raw analyses with colleagues and polished intuitive dashboards to the entire org. This ensures that insights are not siloed but are instead leveraged across teams to inform product decisions and the overall strategy of the company.