So where do you start? And how do you structure your analytics so they actually support better product decisions, rather than overwhelm you?
This post introduces a high-level framework to help you use data systematically to drive product improvement. Think of it as the foundation your other tools and analysis techniques sit on.
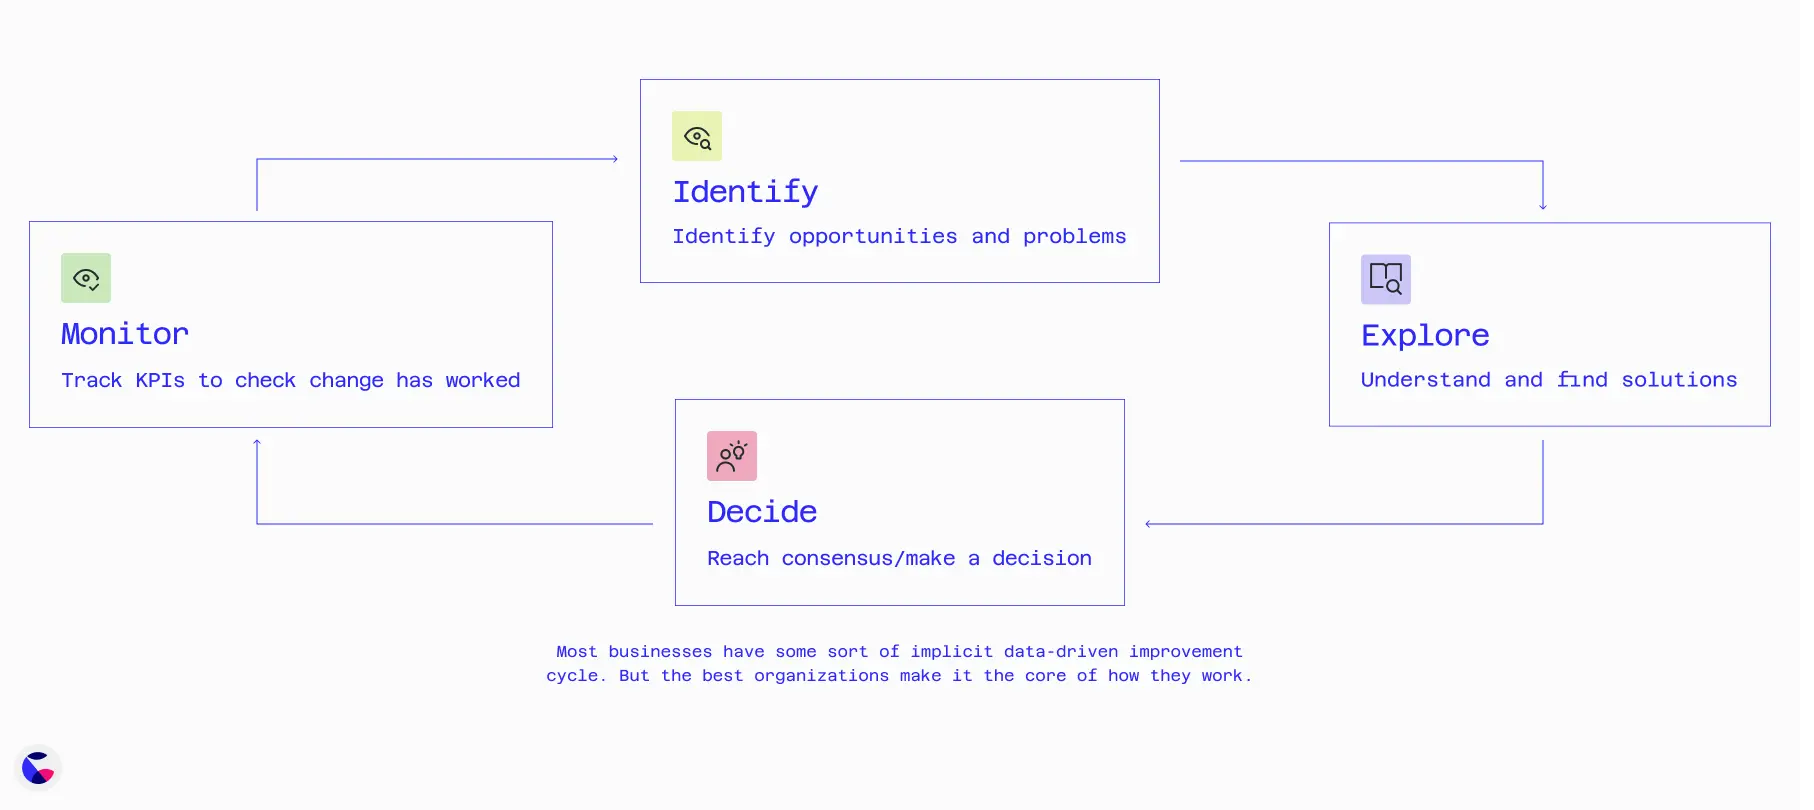
Introducing the improvement cycle
Whether you're doing it explicitly or not, you're already using some version of the improvement cycle. It's the process by which information (both quantitative and qualitative) fuels decision-making.
This isn't a new concept. You see it in Lean Six Sigma (DMAIC), growth programs like Reforge, and even the scientific method: observe, hypothesize, test, and learn.
The idea of the cycle is to:
- Use data to support the identification of growth opportunities
- Find solutions that unlock that opportunity
- Confidently take action
- Check the expected results have been delivered (something everyone forgets)
The real question isn’t if you're using it. It's how well you’re doing it.
Here's how to think about each phase of the cycle.
1. Identify: focus on the right problems
The goal here is clarity. You want to zero in on the biggest opportunities or problems in your product.
Not what happens to come next in the queue.Not what’s wanted by those who shout loudest.
But the things that are most likely to move the needle in the biggest possible way.
Sources of insight:
- Customer feedback, user interviews, strategic goals
- Usage metrics, conversion rates, drop-offs
The challenge:
It’s not accessing data for the above mentioned insights. It’s consolidating it all into a single, clear, concise view of your product’s usage and bottlenecks.
If your data is scattered across dashboards, tools, and teams, you're likely getting an incomplete picture.
Helpful approaches:
- Visualize how your product grows and where the bottlenecks are
- Connect your product flows with relevant KPIs
North star metrics are crucial here. You need to identify what the key drivers are and be able to spot underperformers.
Here’s an example of what this could look like in a Count canvas:
Other useful examples:
2. Explore: diagnose and generate solutions
Once you've zeroed in on a problem area, it’s tempting to jump straight into solution mode. But this is the moment to pause, investigate, and explore.
Before you can build anything meaningful, you need to understandwhythe problem exists in the first place.
That means:
- Peeling back the layers
- Questioning assumptions
- Digging into the details
All this needs to be done both in your data and through direct user feedback.
Only then can you confidently move forward with solutions that address the root cause, not just the symptoms
Methods to explore:
- User journey mapping
- Segmenting cohorts to see who’s affected (and how)
- Hypothesis testing via interviews and data deep-dives
Make this a collaborative process. Bring in cross-functional perspectives to avoid blind spots and generate creative ideas.
An exploration canvas might look something like this:
3. Decide: choose a path forward
You've uncovered the root cause and surfaced some promising ideas. Now comes the critical decision point.
This is where momentum can build or stall. It’s easy for teams to get stuck in analysis or fall back on the safest, most familiar option.
But the goal here is to make a thoughtful, informed decision and commit. Now it's time to evaluate options and pick the best move.
How to decide:
- Weigh effort vs. potential impact
- Gather both qualitative and quantitative evidence
- Tell a compelling story that justifies your decision
This is where product intuition meets hard evidence. It’s not about perfect data—it’s about building a strong enough case to act confidently.
If using Count, here's where you could formulate your exploration findings above into logical frames to tell the story you want to tell. Then, just share with others inreport mode:
4. Monitor: measure the impact
This is the most neglected step. Yet it’s the most critical.
Your team has made a decision, implemented a solution, and likely moved on to the next initiative. But now’s the time to just hit the brakes and slow down again.
Because the real value of all your previous work hinges on what happens next.
Did your solution actually make a difference? Did it move the metric you cared about? Did it solve the underlying problem, or just mask it temporarily?
Answering these questions isn’t always glamorous. But it’s where real learning and long-term improvement happen.
What to monitor:
- The same metrics you used to identify the problem
- Cohort analyses to isolate the effect
- (If possible) Controlled experiments or A/B tests
It’s tempting to skip this part once something ships, but without measurement, there’s no learning—and no real improvement.
How this ties into product management
This framework aligns closely with theShape Upmethodology.
Popularized by Basecamp,Shape Upemphasizes fixed cycles of work and deliberate planning. It encourages teams to "shape" meaningful bets before entering a build cycle.
The improvement cycle complements this by offering a way to identify and validate those bets using data:
- Identify → Explore → Decide
- Monitor
Rather than starting with a solution and backfilling the rationale, product teams can use the cycle to systematically surface problems, explore options, and decide what’s truly worth building.
It also reinforces the importance of the cool-down period. Monitoring isn't just maintenance—it's where you verify whether your bets paid off.
This step closes the loop and feeds new insights back into the shaping process.
Turn insight into action: build smarter with the improvement cycle
Data doesn’t replace product judgment—it strengthens it. When used thoughtfully, the improvement cycle helps product leaders make smarter bets, move faster, and drive meaningful outcomes.
Bottom line: Build your analytics and decision-making processes around this cycle, and you’ll spend less time chasing dashboards and more time improving your product.
Ready to put this into practice? Explore our productcanvas examplesand give Count a try today.