The Data Trust Equation
“Those numbers aren’t right.”
This phrase more than any other, was the one I hated when I was an analyst. Especially when it wasn’t phrased as a question or an invite for further review, it was a sentencing. Whatever I had worked on — a dashboard, chart, model — was rendered meaningless with just a few short words.
Trust is essential for data teams, which is why after writing about itagainandagain, I find myself coming back to the topic once more.
This time with a new and refined understanding.
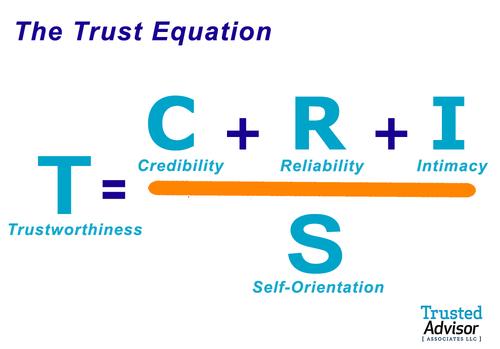
The Trust Equation
The Trusted Advisor by David H. Maister, Robert Galford, and Charles H. Green, features a concept called theTrust Equation. This framework demystifies the core components of establishing trust in any relationship, but in particular for consultants working to become trusted advisors of their clients.

When I first came across this formula, I was surprised at how general it seemed. This was not, like many things from the consulting world, a mess of unrelatable business jargon, but something that felt real, and personal. (Although nothing says ‘I’m a consultant’ like building formulas for non-mathematical concepts.)
The bigger point the authors are making here is thattrust is about people.
Therefore the ways that we gain (and lose trust) must focus on ourselves, and our relationships with others.
Green does not prescribe how consultants should become more credible or reliable, or less self-orientated, but creates a framework by which they can work out the best ways for themselves. Similarly, the formula is just as effective for an individual trying to be more trustworthy as it is for an entire team or organization.
Data teams and data practitioners could undergo a similar exercise with the Trust Equation as Green presents it, and they would likely create many positive changes as a result.
However, I also believe that there is something to be gained by creating a framework even more tailored to data teams and their specific trust challenges.
This is what I set out to do.
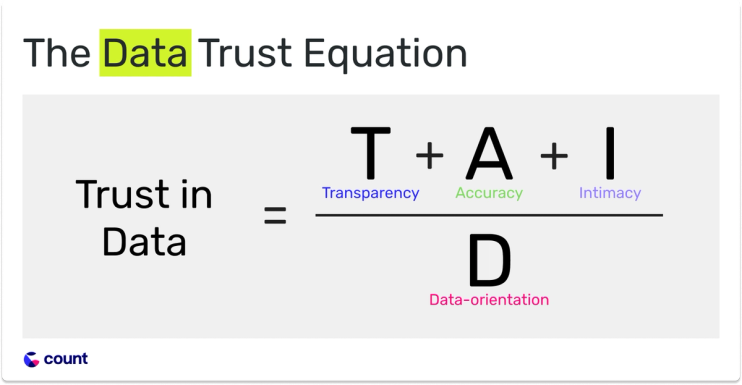
The Data Trust Equation
To do this, I looked back on the dozens of interviews and conversations I’ve had with data leaders over the last year or so in search of any patterns and themes in what they said.
The result is the following formula — a trust equation built specifically for data teams.

Transparency
Be open. Share your story.
This is counter-intuitive for many data people who believe a ‘business person’ would never want to look at your code, or even sit down to understand your world. However, it comes up again and again from data leaders who are building trusted organizations.
Some examples include:
- Showing your work, not just a final number in a dashboard
- Having regular meetings with stakeholders to review key metrics & challenges
- Making the data team’s priorities and process visible and understood by everyone
Transparency is something at the core of why we builtCountand the benefits of transparency are something we hear as their most surprising benefits of the tool — it improves collaboration, workflow efficiency and a general growth in understanding.
Accuracy
Yeah, make sure the numbers are right.
It goes without saying that as best you can, you should really try to make sure your numbers are accurate.
But numbers being ‘wrong’ is rarely a mathematical or even logical error — it is almost always a misalignment of expectations.
Running to dbt and adding dozens of tests could be very effective in catching data and logical errors, but it will not help you if you and your stakeholders have fundamentally different ideas of what the answer should be.
So yes, go and please make sure your data is as accurate as possible, but don’t neglect the first step of defining what ‘accurate’ means to you and the wider business.
Intimacy
Be there. Make sure they feel safe to get involved.
Intimacy is the only variable I kept from the original Trust Equation because its central theme — to make you feel safe — still holds.
But what does ‘safety’ look like in a data context?
Often I’ve seen that to mean regularly meeting with stakeholders and actively curating curiosity about data.
This might look mean:
- regular meetings with stakeholders to review key metrics and progress
- finding a way to reward people when they ask questions about data, rather than punishing them with request forms and long wait times
Data-orientation (vs. Business-orientation)
Show that you aren’t just a data expert. You care about the business and its biggest problems.
The us/them dynamic most data teams face is often down to this question or orientation. It’s easy to become very insular within a data team due to the org structure, or simply being so far away from where the action is happening.
However, this data orientation deteriorates trust. It prevents a common understanding and a common goal between data and business teams. As such, it is the job of data leaders to make sure their teams have a certain level of business awareness and empathy.
Where to begin
If you feel like your organization isn’t trusting data, the following are some tips from data leaders on where to begin:
- Start with a survey to better understand your trust problem. There’s a primer on that topic.
- Start mapping out a big problem one of your business partners is facing.
“You’ve got to start by getting a common understanding of your business either a metric tree or a conversion funnel. Getting alignment on language here can be challenging, so visualizing this is so valuable to get on the same page.” — Eric Bloedorn, Director of Project management at BOLD PENGUIN
3. Try bringing your stakeholders into the analytical process much sooner for the project you’re working on right now. Have a check-in and share your progress with them, and what you plan to do next.
4. For widely-used metrics, ask stakeholders to define what that metric means to them. If they all have different explanations, its your job to align on a single definition, and make sure that’s widely understood.
Tooling to help
As I’ve mentioned above trust is fundamentally a people problem. But that doesn’t mean tooling can’t help. I often meet data teams who have done all they technically can to improve trust — but still have an issue. To them, I would humbly suggest they take a look at whether their tooling is aiding their ability to work and communicate with the business.
We’ve builtCountfor this purpose but there are alternative tools that can aid “collaboration” to a greater or lesser extent.